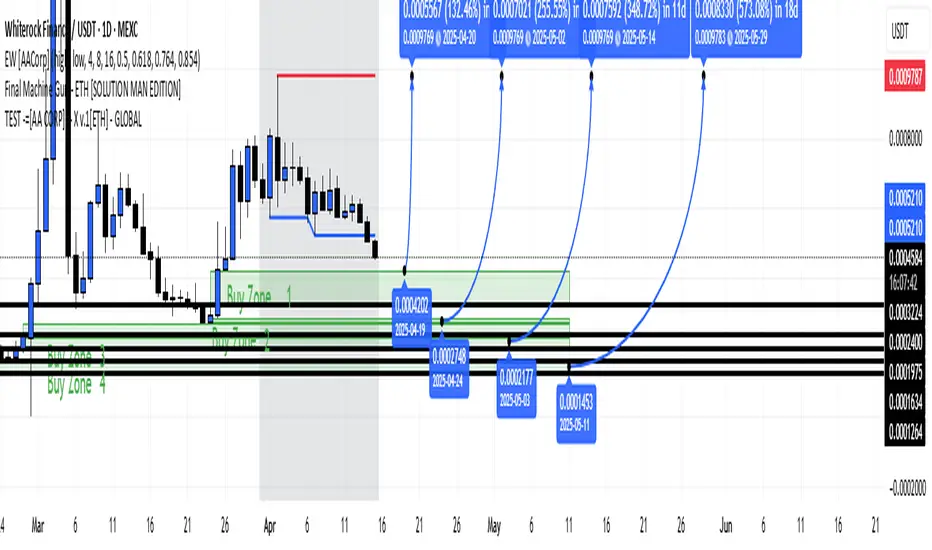
This forecast chart for Ethereum (ETH) against Bitcoin (BTC) on a 4-hour timeframe (EW [AACorp]) projects potential price movements through 2025. The chart highlights four key "Buy Zones" for ETH/BTC, identified between 0.0001274 and 0.0004022, with specific entry points dated from 2025-04-19 to 2025-11-14. The price is expected to consolidate within these zones before a breakout, targeting a global high of 0.0009797 around 2025-05-29. The forecast also marks a significant resistance at 0.0005210, labeled as the "Final Machine Gun," which aligns with historical highs. The chart suggests a strong bullish trend for ETH/BTC, with a potential 573.8% increase from the lowest buy zone to the peak, spanning an 18-month period. However, the "SOLUTION MAN ENTITY" label and test notation indicate this is a hypothetical or algorithmic projection, not a guaranteed outcome.
Entry: Long at $1,675 (current price on 1m).
Target: $1,839 (FVG and resistance, +9.8% move).
Stop-Loss: $1,650 (below the order block, -1.5% move).
Entry: Long at $1,675 (current price on 1m).
Target: $1,839 (FVG and resistance, +9.8% move).
Stop-Loss: $1,650 (below the order block, -1.5% move).
Disclaimer
The information and publications are not meant to be, and do not constitute, financial, investment, trading, or other types of advice or recommendations supplied or endorsed by TradingView. Read more in the Terms of Use.
Disclaimer
The information and publications are not meant to be, and do not constitute, financial, investment, trading, or other types of advice or recommendations supplied or endorsed by TradingView. Read more in the Terms of Use.