This chart forms part of a larger research note. None of the information posted here (TV) should be considered financial advice.
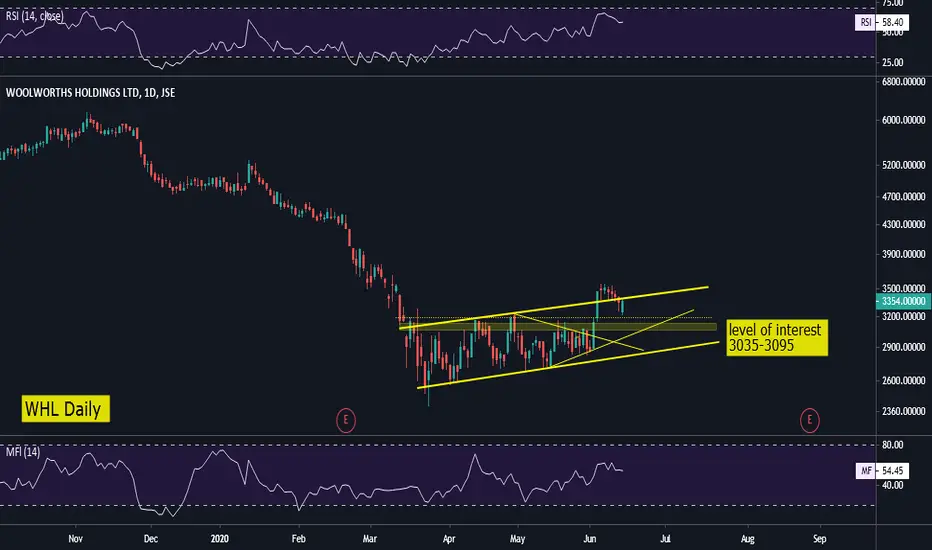
The week before last the share made a false upside break of the gradually upward trending channel. We have since seen a pullback with the price nearing the horizontal level of interest which is also the prior breakout zone (yellow shaded area). This comes in at around 3035-3095c and provides a potential accumulation zone for short term ‘range traders’. I’d like to see the price hold at at this zone, for a potential move back up to 3400c. Note: the 50-day EMA has started to gradually turn higher, suggesting a shift in the medium term trend from sideways consolidation to bullish. Here, we may see a back-test to below the 50-EMA before a regaining of this level.
The week before last the share made a false upside break of the gradually upward trending channel. We have since seen a pullback with the price nearing the horizontal level of interest which is also the prior breakout zone (yellow shaded area). This comes in at around 3035-3095c and provides a potential accumulation zone for short term ‘range traders’. I’d like to see the price hold at at this zone, for a potential move back up to 3400c. Note: the 50-day EMA has started to gradually turn higher, suggesting a shift in the medium term trend from sideways consolidation to bullish. Here, we may see a back-test to below the 50-EMA before a regaining of this level.
Disclaimer
The information and publications are not meant to be, and do not constitute, financial, investment, trading, or other types of advice or recommendations supplied or endorsed by TradingView. Read more in the Terms of Use.
Disclaimer
The information and publications are not meant to be, and do not constitute, financial, investment, trading, or other types of advice or recommendations supplied or endorsed by TradingView. Read more in the Terms of Use.