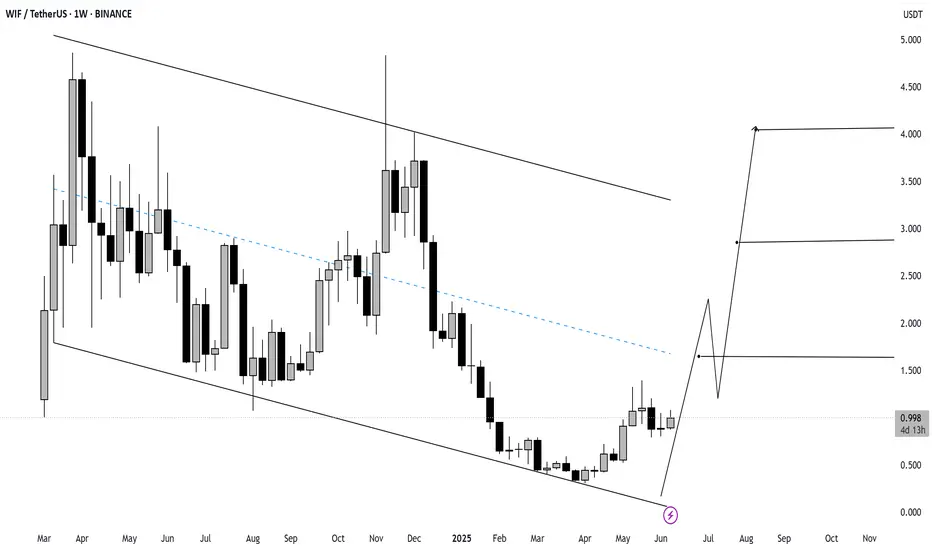
The chart for WIF (Dogwifhat) on the weekly timeframe shows a bullish breakout setup emerging from a long-term descending channel. Price has bounced off the lower boundary and is now pushing higher.
🔍 Key Technical Highlights:
Current Price: $0.996
Structure: Descending channel (breakout in progress)
Momentum: Weekly candle closed +12.04%, indicating strength
🎯 Potential Upside Targets:
$1.70 – Breakout confirmation zone
$3.00 – Mid-channel horizontal resistance
$4.20 – Full breakout target at channel top
📈 Technical Outlook:
A clean breakout above $1.00 and hold above it may validate the bullish reversal.
Watch for a retest of $1.00 as support before continuation.
If momentum continues, WIF could target $3.00 and $4.20 in the coming weeks.
📌 Summary Strategy:
Buy Zone: On confirmation of breakout & retest (~$1.00)
TP1: $1.70
TP2: $3.00
TP3: $4.20
Invalidation: Break below $0.85 (channel base)
Subscribe to my Telegram Channel 👉 :
t.me/addlist/y5mi70s3c0Y3MDQ0
Subscribe to my X 👉 : x.com/VIPROSETR
t.me/addlist/y5mi70s3c0Y3MDQ0
Subscribe to my X 👉 : x.com/VIPROSETR
Disclaimer
The information and publications are not meant to be, and do not constitute, financial, investment, trading, or other types of advice or recommendations supplied or endorsed by TradingView. Read more in the Terms of Use.