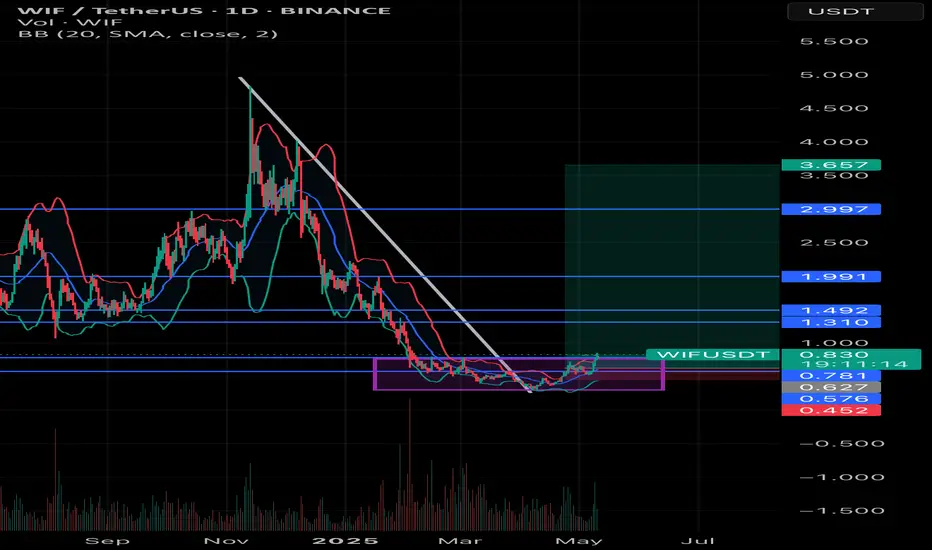
Chart Highlights:
• Strong accumulation zone: WIF consolidated in a range (marked in purple box) between ~$0.45 and ~$0.78, showing multiple rejections at the lower boundary — signaling strong buying pressure.
• Breakout from downtrend: The white trendline indicates a break from the major downtrend, suggesting a trend reversal.
• Bollinger Bands Squeeze & Expansion: The price has broken above the mid-band with volume, implying momentum is building up.
• Targets based on key resistance levels:
• TP1: $1.31
• TP2: $1.49
• TP3: $1.99
• TP4: $3.00
• TP5 (near ATH retest): $3.65
Entry Zone: $0.78–$0.83
Stop-Loss: Below $0.62 (just under accumulation zone)
Risk-Reward: Solid R:R potential if it breaks $1.00 with volume
Disclaimer
The information and publications are not meant to be, and do not constitute, financial, investment, trading, or other types of advice or recommendations supplied or endorsed by TradingView. Read more in the Terms of Use.
Disclaimer
The information and publications are not meant to be, and do not constitute, financial, investment, trading, or other types of advice or recommendations supplied or endorsed by TradingView. Read more in the Terms of Use.