Hi Traders,
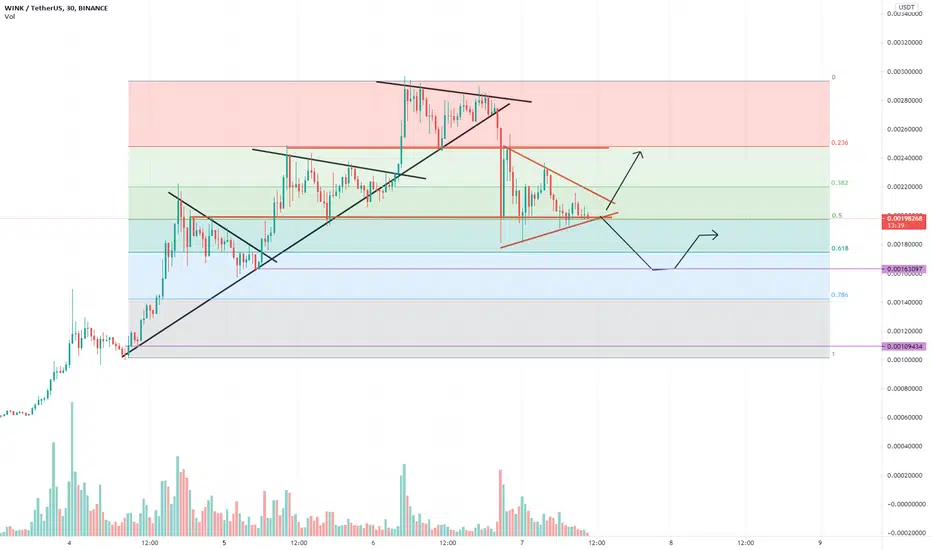
The chart explains it.
Is it going down to complete the target for a rising wedge or
Its not a wedge and its a shakeout.
Now lets look at the indicators.
4 HRLY sidewards movement and just below the 20 ema, so more pressure down


Looks like a break to the downside, nice shorting opportunity

Regards,
S.Sari
DAILY shows downward pressure however not down and out

My call, its not hard

The chart explains it.
Is it going down to complete the target for a rising wedge or
Its not a wedge and its a shakeout.
Now lets look at the indicators.
4 HRLY sidewards movement and just below the 20 ema, so more pressure down
Looks like a break to the downside, nice shorting opportunity
Regards,
S.Sari
DAILY shows downward pressure however not down and out
My call, its not hard
Note
The bullish perspectiveTrade closed: target reached
no trade for me. Difficult to short.Note
Still stalking itNote
Discord: discord.com/invite/vb4hbP88vb (TradeToProspa)
Telegram: t.me/TprospaTradersbot
This community has signals now but with no risk management comms.
Telegram: t.me/TprospaTradersbot
This community has signals now but with no risk management comms.
Related publications
Disclaimer
The information and publications are not meant to be, and do not constitute, financial, investment, trading, or other types of advice or recommendations supplied or endorsed by TradingView. Read more in the Terms of Use.