Summary:
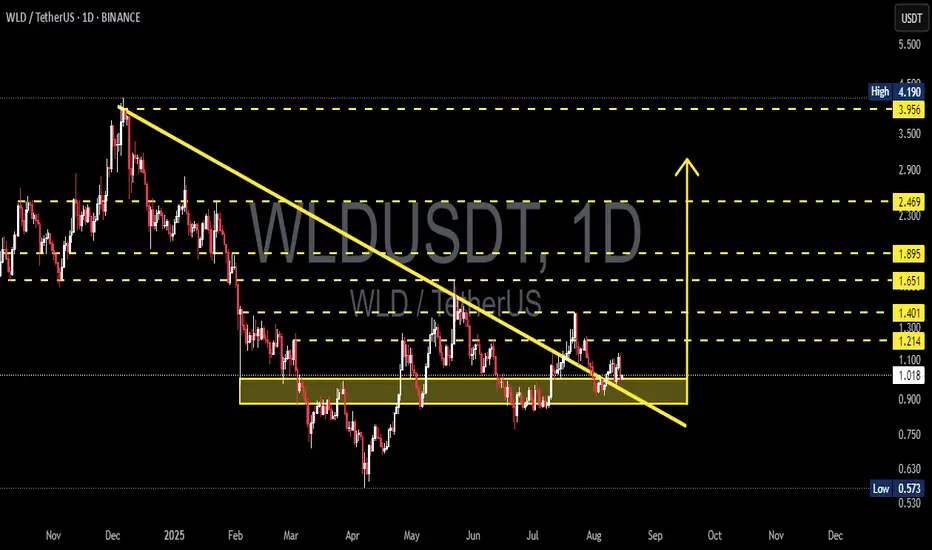
Price is sitting right inside a major demand zone (~0.90–1.10 USDT) after previously breaking above and then pulling back around the long-term descending trendline (yellow line). This zone has repeatedly acted as a strong floor — the next move (bounce & rally vs. breakdown) will set the medium-term direction.
---
Key Levels
Current price ≈ 1.014 USDT (dotted line).
Demand / support zone: ~0.90 – 1.10 USDT (yellow box).
Resistances / upside targets: 1.214, 1.401, 1.651, 1.895, 2.469 USDT.
Structural high: ~3.95 – 4.19 USDT.
Major low: 0.573 USDT.
---
Pattern Analysis
1. Multi-month descending trendline — the yellow line shows a sustained downtrend from Dec–Jan highs. Sellers have dominated until a potential structural shift.
2. Breakout & retest — price broke above the trendline earlier but fell back into the demand zone → this could be a breakout + retest (bullish) or a false breakout / bull trap (bearish) depending on confirmation from price & volume.
3. Range / consolidation — since March–May, price has been oscillating around the yellow box → a clear accumulation/demand area.
4. Lower highs structure is still visible on the higher timeframe — sellers are not fully out of the picture.
---
Bullish Scenario
Confirmation needed: Daily close above 1.214 USDT (stronger if backed by higher volume).
Conservative plan: Wait for a daily close > 1.214 and enter on a retest; stop below 1.01), stop tight at 0.88.
Example R:R (entry 1.014, stop 0.88):
Target 1: 1.214 → +19.7% upside, ~13.2% risk → R:R ≈ 1.5:1.
Target 2: 1.401 → +38.2% upside → R:R ≈ 2.9:1.
Target 3: 1.651 → +62.8% upside → R:R ≈ 4.8:1.
Note: Hold / trail stop after 1.401 break to maximize potential.
---
Bearish Scenario
Confirmation needed: Daily close below 0.90 with strong selling volume.
Downside targets: Next major support ~0.57 USDT, with intermediate zone around 0.63–0.75 likely tested first.
Example short setup: Entry after breakdown (<0.90), stop above 1.214. Entry 0.90, stop 1.214, target 0.573 → ~36.3% profit, ~34.9% risk → R:R ≈ 1.04:1 (less attractive unless strong confirmation).
Note: A breakdown of this demand zone could trigger a sharp sell-off — use stop-loss.
---
Key Confirmation Signals
Volume spike during breakout/breakdown (volume up = stronger validation).
Daily/weekly close above resistance or below support (avoid false wicks).
Momentum indicators: Bullish divergence on RSI / MACD cross for longs; bearish momentum (falling RSI, MACD cross down) for shorts.
Trendline reaction: Long upper wicks = rejection; clean close = strength.
---
Risk Management Tips
Confirm setups on daily + 4H before entry.
Limit risk per trade (e.g., 1–2% of capital).
Beware of bull traps — don’t overleverage on weak-volume breakouts.
Use trailing stops when in profit.
---
> WLD/USDT — Testing major demand zone (0.90–1.10).
Previous breakout failed to hold momentum → price is back inside the accumulation zone. Watch for daily close >1.214 (bullish) or breakdown <0.90 (bearish). Manage your risk.
#WLDUSDT #Worldcoin #CryptoAnalysis #SupportResistance #Breakout #Retest #BullVsBear #TechnicalAnalysis #RiskManagement
✅ Get Free Signals! Join Our Telegram Channel Here: t.me/TheCryptoNuclear
✅ Twitter: twitter.com/crypto_nuclear
✅ Join Bybit : partner.bybit.com/b/nuclearvip
✅ Benefits : Lifetime Trading Fee Discount -50%
✅ Twitter: twitter.com/crypto_nuclear
✅ Join Bybit : partner.bybit.com/b/nuclearvip
✅ Benefits : Lifetime Trading Fee Discount -50%
Disclaimer
The information and publications are not meant to be, and do not constitute, financial, investment, trading, or other types of advice or recommendations supplied or endorsed by TradingView. Read more in the Terms of Use.