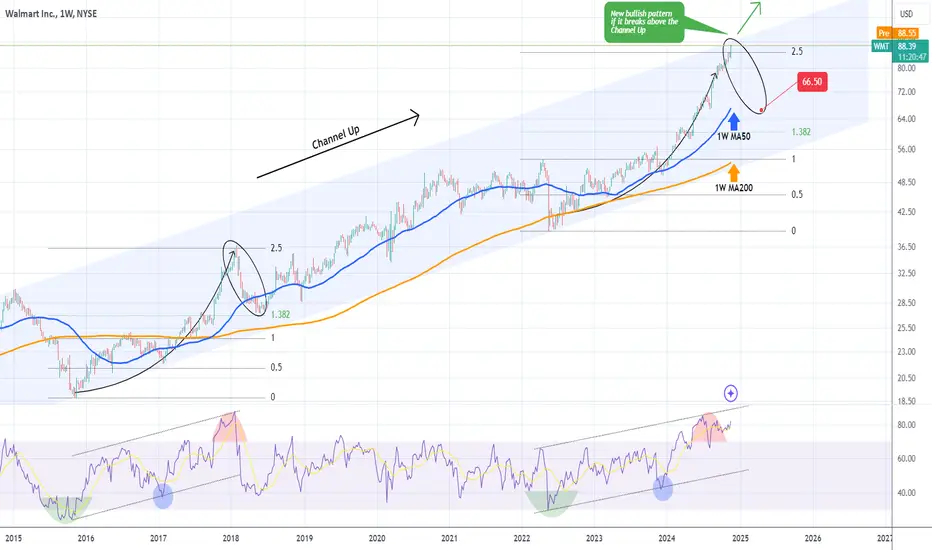
Walmart (WMT) has been trading within a 10-year Channel Up pattern since the January 12 2015 High. The price has finally reached the top (Higher Highs trend-line) of this decade-long bullish pattern and that is easily identifiable by the 1W RSI sequence.
The rally that started on the May 16 2022 bottom is very similar to the one that started on the October 26 2015 bottom. The two fractals initially started rebounding and on the first 0.5 Fibonacci test, they held it and entered a more aggressive rally, supported by the 1W MA50 (blue trend-line).
The past one peaked just above the 2.5 Fibonacci extension (January 29 2018). The current week has put us above the 2.5 Fib ext and right at the top of the Channel Up. If it replicates the Jan - May 2018 correction, it could test $66.50. If it closes above the Channel Up though, a new bullish pattern will emerge and we will re-evaluate with the price action we get at that time. However it is easily understandable that having an SL at the top is worth taking the short's risk as the potential reward is much greater than the risk. And if it fails the loss is minimal and we can still follow the bullish trend with a break-out buy.
-------------------------------------------------------------------------------
** Please LIKE 👍, FOLLOW ✅, SHARE 🙌 and COMMENT ✍ if you enjoy this idea! Also share your ideas and charts in the comments section below! This is best way to keep it relevant, support us, keep the content here free and allow the idea to reach as many people as possible. **
-------------------------------------------------------------------------------
💸💸💸💸💸💸
👇 👇 👇 👇 👇 👇
👑Best Signals (Forex/Crypto+70% accuracy) & Account Management (+20% profit/month on 10k accounts)
💰Free Channel t.me/tradingshotglobal
🤵Contact info@tradingshot.com t.me/tradingshot
🔥New service: next X100 crypto GEMS!
💰Free Channel t.me/tradingshotglobal
🤵Contact info@tradingshot.com t.me/tradingshot
🔥New service: next X100 crypto GEMS!
Disclaimer
The information and publications are not meant to be, and do not constitute, financial, investment, trading, or other types of advice or recommendations supplied or endorsed by TradingView. Read more in the Terms of Use.