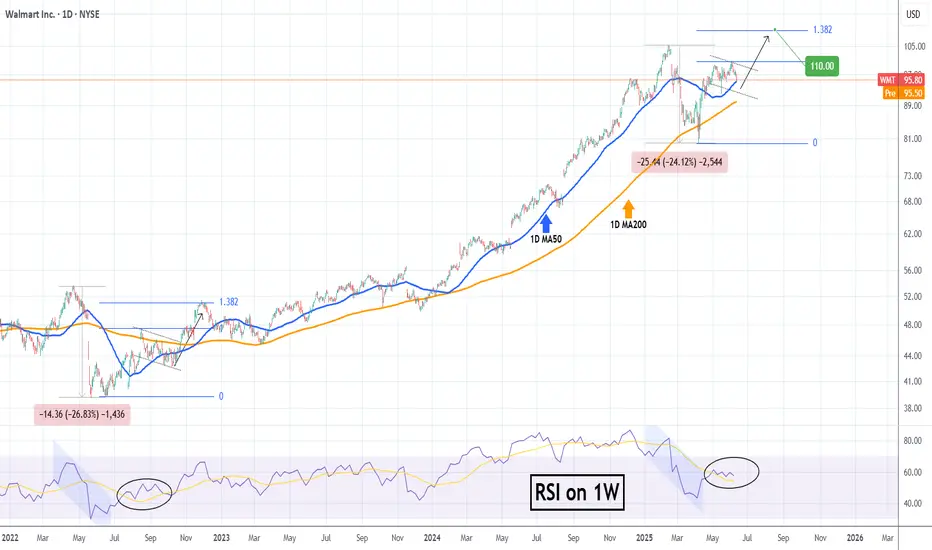
Walmart (WMT) hit yesterday its 1D MA50 (blue trend-line) for the first time since April 21. It appears that the rebound from the Trade War Low has turned sideways on a Double Top formation and the 1D MA50 is the first Support to be tested, with the 1D MA200 (orange trend-line) following.
This pattern resembles the August - September 2022 Bull Flag, which despite breaking below its 1D MA50, it resumed the uptrend shortly after and hit the 1.382 Fibonacci extension before the next 1D MA50 pull-back.
As a result, we expect the stock to reach $110.00 (Fib 1.382) by the end of the Summer.
-------------------------------------------------------------------------------
** Please LIKE 👍, FOLLOW ✅, SHARE 🙌 and COMMENT ✍ if you enjoy this idea! Also share your ideas and charts in the comments section below! This is best way to keep it relevant, support us, keep the content here free and allow the idea to reach as many people as possible. **
-------------------------------------------------------------------------------
💸💸💸💸💸💸
👇 👇 👇 👇 👇 👇
👑Best Signals (Forex/Crypto+70% accuracy) & Account Management (+20% profit/month on 10k accounts)
💰Free Channel t.me/tradingshotglobal
🤵Contact info@tradingshot.com t.me/tradingshot
🔥New service: next X100 crypto GEMS!
💰Free Channel t.me/tradingshotglobal
🤵Contact info@tradingshot.com t.me/tradingshot
🔥New service: next X100 crypto GEMS!
Disclaimer
The information and publications are not meant to be, and do not constitute, financial, investment, trading, or other types of advice or recommendations supplied or endorsed by TradingView. Read more in the Terms of Use.