Chart Analysis (1D Time Frame):
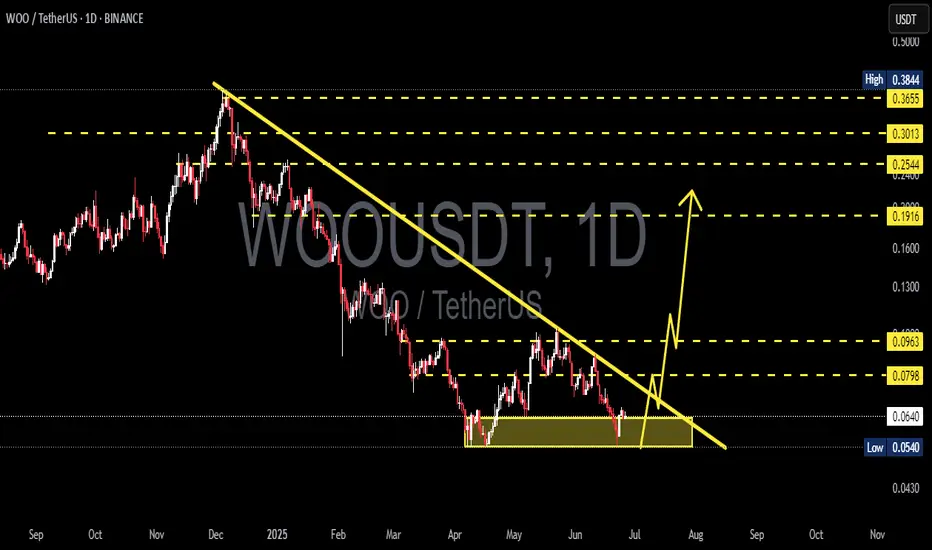
This WOO/USDT chart shows a potential breakout setup after months of accumulation and downward pressure.
📉 Descending Trendline Resistance:
The price has been in a steady downtrend since December 2024, repeatedly rejecting from a descending resistance line.
🟨 Strong Accumulation & Support Zone (0.0540 – 0.0643 USDT):
A strong horizontal support zone has formed since April 2025. Price has bounced multiple times from this area, indicating growing buying pressure.
📈 Breakout Potential:
If WOO breaks above the descending trendline with strong volume, this could signal the start of a major bullish move.
🎯 Potential Upside Targets (Key Resistance Levels):
1. 0.0798 USDT – Initial breakout confirmation.
2. 0.0963 USDT – First bullish target.
3. 0.1334 USDT – Medium-term target.
4. 0.1916 USDT – Aggressive target.
5. 0.2544 USDT – Extended bullish continuation target.
6. 0.3655 – 0.3844 USDT – Long-term major resistance zone.
⚠️ Risk Note:
A fake breakout is possible if the volume is weak. If price breaks below the accumulation zone, the bearish trend may continue.
📌 Conclusion:
WOO is at a critical decision point. A confirmed breakout from this descending structure could trigger a significant bullish rally. A must-watch setup for both traders and investor.
✅ Get Free Signals! Join Our Telegram Channel Here: t.me/TheCryptoNuclear
✅ Twitter: twitter.com/crypto_nuclear
✅ Join Bybit : partner.bybit.com/b/nuclearvip
✅ Benefits : Lifetime Trading Fee Discount -50%
✅ Twitter: twitter.com/crypto_nuclear
✅ Join Bybit : partner.bybit.com/b/nuclearvip
✅ Benefits : Lifetime Trading Fee Discount -50%
Disclaimer
The information and publications are not meant to be, and do not constitute, financial, investment, trading, or other types of advice or recommendations supplied or endorsed by TradingView. Read more in the Terms of Use.