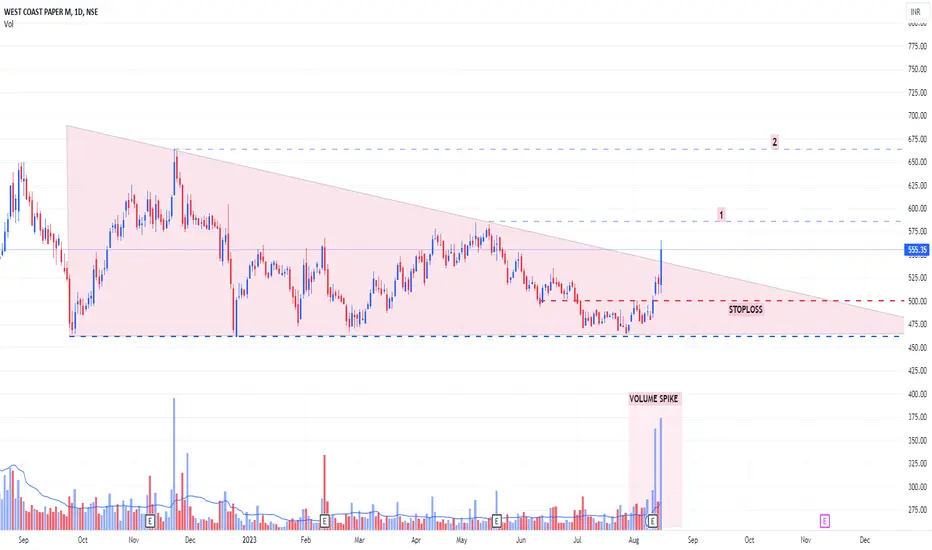
TARGETS AND STOPLOSS IN CHART
Market Cap
₹ 3,664 Cr.
Stock P/E
3.62
Book Value
₹ 390
Dividend Yield
1.80 %
ROCE
61.8 %
ROE
44.8 %
Face Value
₹ 2.00
Promoter holding
56.5 %
EPS last year
₹ 143
EPS latest quarter
₹ 37.2
Debt
₹ 231 Cr.
Pledged percentage
0.00 %
Net CF
₹ 9.93 Cr.
Price to Cash Flow
2.96
Free Cash Flow
₹ 1,077 Cr.
Debt to equity
0.09
OPM last year
33.5 %
OPM 5Year
24.5 %
Reserves
₹ 2,565 Cr.
Price to book value
1.42
Int Coverage
43.4
PEG Ratio
0.11
Price to Sales
0.74
Market Cap to Sales
0.74
Trade active
TARGET 1 DONE - 600Trade active
Target 2 doneTrade active
Target achieved - Keep TrailingTrade active
Keep trailingDisclaimer
The information and publications are not meant to be, and do not constitute, financial, investment, trading, or other types of advice or recommendations supplied or endorsed by TradingView. Read more in the Terms of Use.
Disclaimer
The information and publications are not meant to be, and do not constitute, financial, investment, trading, or other types of advice or recommendations supplied or endorsed by TradingView. Read more in the Terms of Use.