WTI Crude Oil Daily Chart Analysis
**Trend & Structure:**
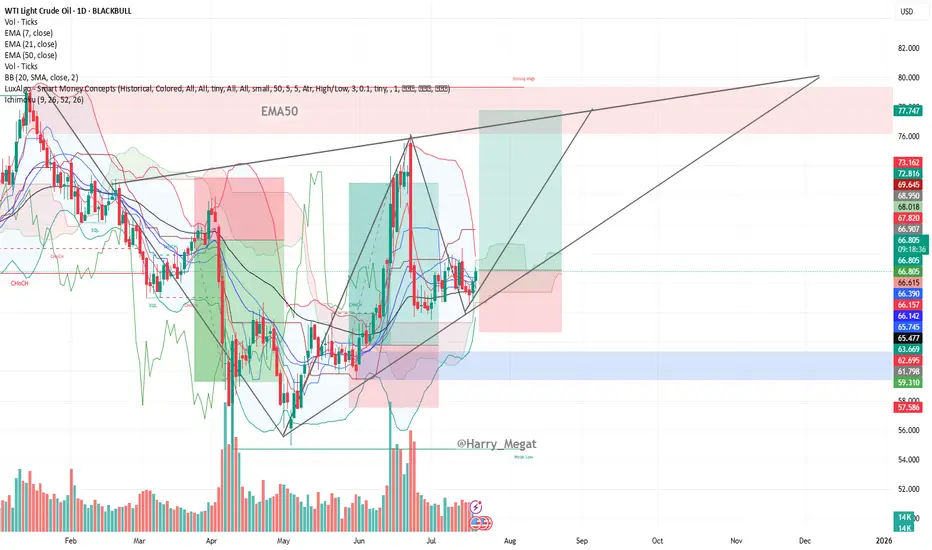
* The chart displays a **symmetrical triangle** formation, signaling a **potential breakout setup**.
* Price is currently trading around **\$66.78**, gradually rising from its recent consolidation.
* **Higher lows** and **lower highs** indicate a tightening range, which usually precedes a sharp move.
**Support & Resistance:**
* **Support Zone:** Around **\$65.47–\$66.15**, marked by the 50 EMA and prior price reactions.
* **Resistance Levels:**
* **\$68.95** – Short-term resistance and previous peak.
* **\$72.81** – Strong horizontal resistance.
* **\$77.75–\$80.00** – Projected upper trendline zone of triangle.
**Moving Averages (Bullish Setup):**
* EMA 7: **\$66.15**
* EMA 21: **\$66.14**
* EMA 50: **\$65.47**
* All EMAs are aligned in bullish order (7 > 21 > 50), confirming **bullish momentum**.
**Volume Insight:**
* Volume remains relatively steady; a spike in volume with breakout from the triangle would confirm trend continuation.
**Trade Setup Suggestion (based on chart):**
* **Breakout Buy Idea:** If price breaks above **\$68.95–\$70**, potential upside to **\$77–\$80**.
* **Invalidation:** A break below **\$65** would invalidate the bullish structure.
**Conclusion:**
WTI crude oil is trading within a symmetrical triangle, supported by bullish EMAs and tightening price action. A breakout above \$69 could trigger a bullish rally toward \$77–\$80. Keep an eye on volume confirmation and geopolitical headlines that can impact oil fundamentals.

**Trend & Structure:**
* The chart displays a **symmetrical triangle** formation, signaling a **potential breakout setup**.
* Price is currently trading around **\$66.78**, gradually rising from its recent consolidation.
* **Higher lows** and **lower highs** indicate a tightening range, which usually precedes a sharp move.
**Support & Resistance:**
* **Support Zone:** Around **\$65.47–\$66.15**, marked by the 50 EMA and prior price reactions.
* **Resistance Levels:**
* **\$68.95** – Short-term resistance and previous peak.
* **\$72.81** – Strong horizontal resistance.
* **\$77.75–\$80.00** – Projected upper trendline zone of triangle.
**Moving Averages (Bullish Setup):**
* EMA 7: **\$66.15**
* EMA 21: **\$66.14**
* EMA 50: **\$65.47**
* All EMAs are aligned in bullish order (7 > 21 > 50), confirming **bullish momentum**.
**Volume Insight:**
* Volume remains relatively steady; a spike in volume with breakout from the triangle would confirm trend continuation.
**Trade Setup Suggestion (based on chart):**
* **Breakout Buy Idea:** If price breaks above **\$68.95–\$70**, potential upside to **\$77–\$80**.
* **Invalidation:** A break below **\$65** would invalidate the bullish structure.
**Conclusion:**
WTI crude oil is trading within a symmetrical triangle, supported by bullish EMAs and tightening price action. A breakout above \$69 could trigger a bullish rally toward \$77–\$80. Keep an eye on volume confirmation and geopolitical headlines that can impact oil fundamentals.
Trade active
WTI Breakout Update* **Breakout Confirmed:** Price has successfully **broken above \$68.95–\$70 range**, reaching **\$69.30+**.
* **Trend:** Bullish breakout from **symmetrical triangle** now in play.
* **Next Targets:**
* 🎯 **\$72.80** (horizontal resistance)
* 🎯 **\$77.75–\$80.00** (upper triangle trendline zone)
Watch Now:
* **Volume:** Watch for rising volume to confirm momentum.
* **Pullback Zone:** Retest near **\$68.95–\$69.00** could offer fresh entries.
* **Risk Management:** Move stop-loss to **breakeven or just below \$68.50** to lock in gains.
Disclaimer
The information and publications are not meant to be, and do not constitute, financial, investment, trading, or other types of advice or recommendations supplied or endorsed by TradingView. Read more in the Terms of Use.
Disclaimer
The information and publications are not meant to be, and do not constitute, financial, investment, trading, or other types of advice or recommendations supplied or endorsed by TradingView. Read more in the Terms of Use.