Technical Analysis – WTI (1H Chart)
Structure & Momentum:
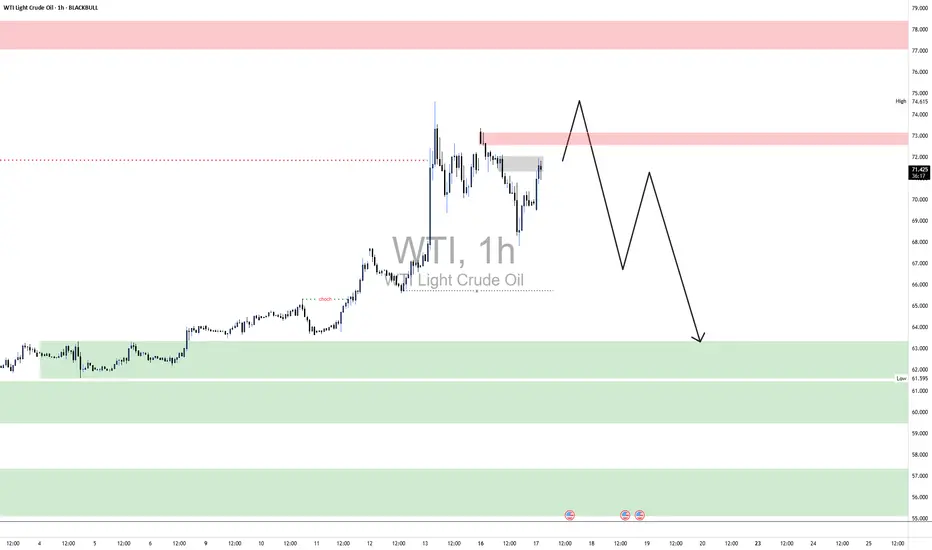
WTI recently broke out of a short-term bullish structure, forming higher highs and higher lows.
However, momentum appears to be weakening, with divergence showing between price action and volume (or internal strength), hinting at a potential short-term pullback.
Liquidity & Reaccumulating:
There’s a visible liquidity pool resting below the recent swing lows, around the $62 level, which aligns with a bullish order block or prior consolidation zone on the 1H chart.
If price revisits this zone, it would likely be a liquidity grab followed by reaccumulating.
✅ Scenario Outlook:
"WTI might pull back to the $62 area to clear resting liquidity and mitigate previous demand imbalances. If the level holds with strong bullish intent, we can expect a continuation toward higher levels—targeting the $67–$70 range in the coming sessions."
Trade Setup Concept (SMC-style):
Wait for price to sweep the $62 level.
Look for a shift in market structure (CHOCH) on lower timeframes from bearish to bullish.
Entry: Post-CHOCH confirmation above local high.
SL: Below liquidity sweep.
TP1: $66.80
TP2: $69.90
🛢️ Geopolitical Context:
If Iran retaliates directly or if Strait of Hormuz tensions rise, crude could spike suddenly.
But U.S. SPR releases or weak global demand data might offset rallies—watch macro data.
Structure & Momentum:
WTI recently broke out of a short-term bullish structure, forming higher highs and higher lows.
However, momentum appears to be weakening, with divergence showing between price action and volume (or internal strength), hinting at a potential short-term pullback.
Liquidity & Reaccumulating:
There’s a visible liquidity pool resting below the recent swing lows, around the $62 level, which aligns with a bullish order block or prior consolidation zone on the 1H chart.
If price revisits this zone, it would likely be a liquidity grab followed by reaccumulating.
✅ Scenario Outlook:
"WTI might pull back to the $62 area to clear resting liquidity and mitigate previous demand imbalances. If the level holds with strong bullish intent, we can expect a continuation toward higher levels—targeting the $67–$70 range in the coming sessions."
Trade Setup Concept (SMC-style):
Wait for price to sweep the $62 level.
Look for a shift in market structure (CHOCH) on lower timeframes from bearish to bullish.
Entry: Post-CHOCH confirmation above local high.
SL: Below liquidity sweep.
TP1: $66.80
TP2: $69.90
🛢️ Geopolitical Context:
If Iran retaliates directly or if Strait of Hormuz tensions rise, crude could spike suddenly.
But U.S. SPR releases or weak global demand data might offset rallies—watch macro data.
Looking for powerful AI trading signals? Visit ProSignal.ai and take your trading to the next level! or join our telegram channel at t.me/prosignalai
Disclaimer
The information and publications are not meant to be, and do not constitute, financial, investment, trading, or other types of advice or recommendations supplied or endorsed by TradingView. Read more in the Terms of Use.