)
✅ Overall Market Structure:
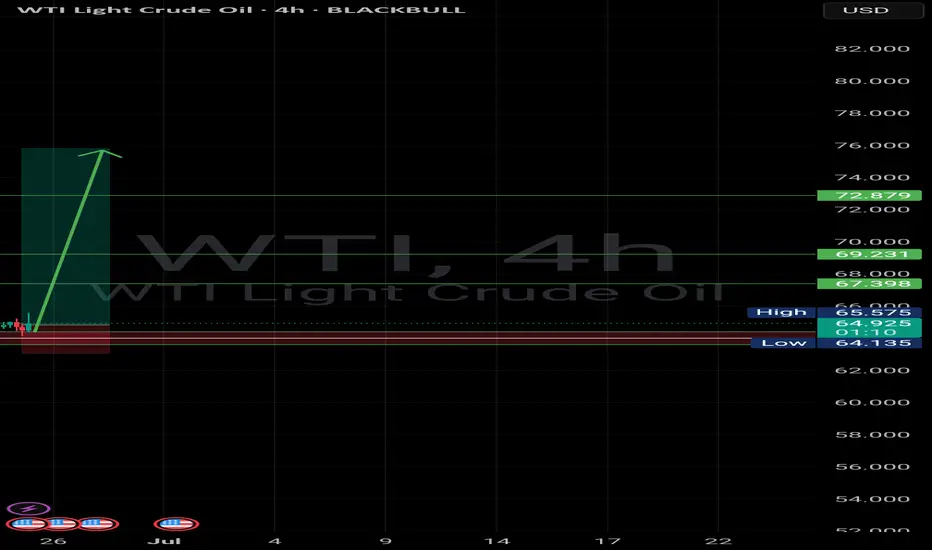
After a steady bullish trend, price has experienced a sharp drop and is now reacting to a demand zone around 64.955. The recent price action suggests signs of potential stabilization and a possible bullish reversal.
---
🟩 Key Levels:
Major Support Zone:
The area between 64.00 – 65.00 acts as a strong demand zone, which has shown prior reactions.
Resistance / Target Levels:
67.398 (first resistance and short-term target)
69.231 (mid-level resistance)
72.879 (main target if bullish momentum continues)
---
📈 Bullish Scenario (Most Probable Based on Current Chart):
After touching the demand zone, price seems to be forming a potential bottom. If a strong bullish candlestick appears (such as a bullish engulfing or hammer), we can expect a corrective or impulsive move to the upside.
🔸 Suggested Stop-Loss: Below 63.80
🔸 Target 1: 67.40
🔸 Target 2: 69.20
🔸 Target 3: 72.80
---
⚠️ Important Notes:
1. Wait for bullish confirmation before entering a trade.
2. If the support at 64 breaks, price may drop further toward the next demand zone around 61.00–60.00 (next major support lies at 59.415).
3. Keep an eye on oil-related news and U.S. economic reports (noted with calendar icons on the chart), as they can strongly impact volatility.
---
✅ Overall Market Structure:
After a steady bullish trend, price has experienced a sharp drop and is now reacting to a demand zone around 64.955. The recent price action suggests signs of potential stabilization and a possible bullish reversal.
---
🟩 Key Levels:
Major Support Zone:
The area between 64.00 – 65.00 acts as a strong demand zone, which has shown prior reactions.
Resistance / Target Levels:
67.398 (first resistance and short-term target)
69.231 (mid-level resistance)
72.879 (main target if bullish momentum continues)
---
📈 Bullish Scenario (Most Probable Based on Current Chart):
After touching the demand zone, price seems to be forming a potential bottom. If a strong bullish candlestick appears (such as a bullish engulfing or hammer), we can expect a corrective or impulsive move to the upside.
🔸 Suggested Stop-Loss: Below 63.80
🔸 Target 1: 67.40
🔸 Target 2: 69.20
🔸 Target 3: 72.80
---
⚠️ Important Notes:
1. Wait for bullish confirmation before entering a trade.
2. If the support at 64 breaks, price may drop further toward the next demand zone around 61.00–60.00 (next major support lies at 59.415).
3. Keep an eye on oil-related news and U.S. economic reports (noted with calendar icons on the chart), as they can strongly impact volatility.
---
Disclaimer
The information and publications are not meant to be, and do not constitute, financial, investment, trading, or other types of advice or recommendations supplied or endorsed by TradingView. Read more in the Terms of Use.
Disclaimer
The information and publications are not meant to be, and do not constitute, financial, investment, trading, or other types of advice or recommendations supplied or endorsed by TradingView. Read more in the Terms of Use.