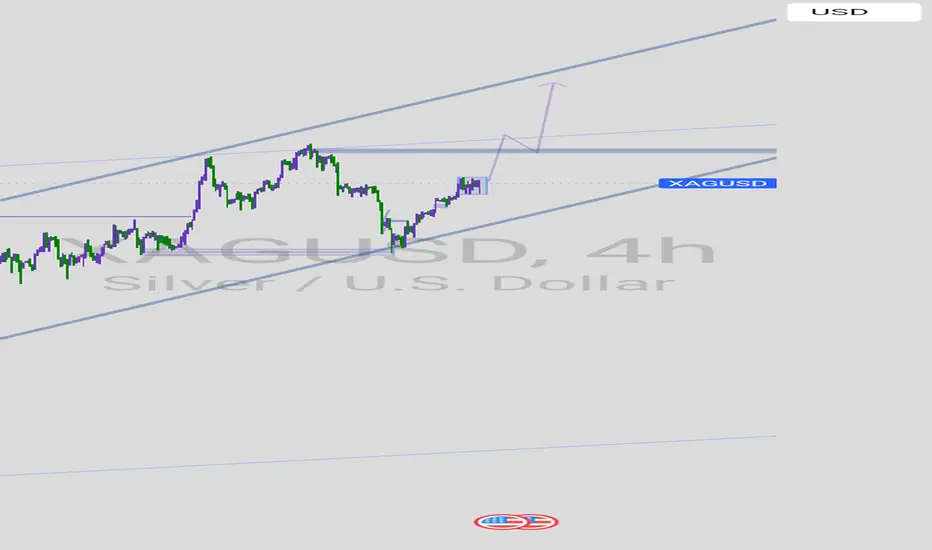
Price has been making higher highs and higher lows and is currently in a small consolidation inside the channel. The annotated purple arrow forecasts a breakout continuation toward the channel’s upper boundary (next major resistance). Bullish bias while price stays inside the channel; a break below the lower channel or the horizontal support invalidates the bullish view.
---
# What the chart shows (observations)
1. **Timeframe:** 4-hour (swing/trend context).
2. **Trend structure:** Long-term uptrend — price moving inside a wide ascending channel drawn with two parallel trendlines (support = lower boundary, resistance = upper boundary).
3. **Horizontal levels:** Several purple horizontal zones mark prior support/resistance — notably a mid-channel support (around where price bounced recently) and a resistance area that price has used previously.
4. **Current price action:** A boxed consolidation (small range) near the mid-to-upper channel area — a classic continuation flag/pennant inside an uptrend.
5. **Projection:** The purple arrow drawn on the chart shows an expected breakout from the small consolidation, retest of the prior resistance (now support) and then a push up toward the upper channel resistance (the chart’s target area).
---
# Technical interpretation
* **Bullish overall:** Higher highs & higher lows inside an ascending channel — that’s bullish.
* **Continuation pattern:** The small boxed consolidation after a prior leg higher looks like a continuation pattern (flag/box). Break above the box → likely continuation to the upper channel.
* **Key supports:** The mid-channel horizontal zone and the rising lower trendline. These are the areas bulls want to hold.
* **Key resistance/target:** The upper channel boundary (and the horizontal resistance near the top) — this is the obvious profit target for longs.
---
# Possible trade ideas (examples, not financial advice)
1. **Aggressive long (momentum):**
* Entry: on clean breakout above the consolidation box with volume/candle confirmation.
* Stop: below the bottom of the box or below the nearby horizontal support.
* Target: first to the purple horizontal / mid-upper resistance, then to the channel top.
2. **Conservative long (pullback):**
* Wait for a breakout, then wait for a retest of the breakout level (or the rising mid-channel support). Enter on a bullish rejection/candle pattern.
* Stop: below retest low.
* Target: channel top.
3. **Invalidation / short idea:**
* If price breaks and closes **below the lower channel trendline** or the major horizontal support zone, that breaks the bullish structure. Consider shorting on confirmation toward the lower channel or a measured move down.
---
# Risk management & things to watch
* **Risk per trade:** size position so your stop loss equals a small % of equity (e.g., 1–2%).
* **Watch macro events:** USD strength, US CPI, Fed rate decisions, and real yields strongly affect silver — they can cause fast moves that blow through technical levels.
* **False breakouts:** Small timeframes can produce fake breakouts; prefer confirmation (close above resistance + follow-through candle).
* **Channel slope changes:** If price chops sideways and slope flattens, the trend may be losing momentum even before a break.
---
# Quick checklist before trading this setup
* Is breakout confirmed by a clean 4-hour close above the box or resistance? ✅
* Is volume / momentum supporting the move? ✅
* Is my stop placed below logical support (not just a random level)? ✅
* Do macro calendars (CPI/Fed/etc.) have events that could spike volatility? ✅
---
# What the chart shows (observations)
1. **Timeframe:** 4-hour (swing/trend context).
2. **Trend structure:** Long-term uptrend — price moving inside a wide ascending channel drawn with two parallel trendlines (support = lower boundary, resistance = upper boundary).
3. **Horizontal levels:** Several purple horizontal zones mark prior support/resistance — notably a mid-channel support (around where price bounced recently) and a resistance area that price has used previously.
4. **Current price action:** A boxed consolidation (small range) near the mid-to-upper channel area — a classic continuation flag/pennant inside an uptrend.
5. **Projection:** The purple arrow drawn on the chart shows an expected breakout from the small consolidation, retest of the prior resistance (now support) and then a push up toward the upper channel resistance (the chart’s target area).
---
# Technical interpretation
* **Bullish overall:** Higher highs & higher lows inside an ascending channel — that’s bullish.
* **Continuation pattern:** The small boxed consolidation after a prior leg higher looks like a continuation pattern (flag/box). Break above the box → likely continuation to the upper channel.
* **Key supports:** The mid-channel horizontal zone and the rising lower trendline. These are the areas bulls want to hold.
* **Key resistance/target:** The upper channel boundary (and the horizontal resistance near the top) — this is the obvious profit target for longs.
---
# Possible trade ideas (examples, not financial advice)
1. **Aggressive long (momentum):**
* Entry: on clean breakout above the consolidation box with volume/candle confirmation.
* Stop: below the bottom of the box or below the nearby horizontal support.
* Target: first to the purple horizontal / mid-upper resistance, then to the channel top.
2. **Conservative long (pullback):**
* Wait for a breakout, then wait for a retest of the breakout level (or the rising mid-channel support). Enter on a bullish rejection/candle pattern.
* Stop: below retest low.
* Target: channel top.
3. **Invalidation / short idea:**
* If price breaks and closes **below the lower channel trendline** or the major horizontal support zone, that breaks the bullish structure. Consider shorting on confirmation toward the lower channel or a measured move down.
---
# Risk management & things to watch
* **Risk per trade:** size position so your stop loss equals a small % of equity (e.g., 1–2%).
* **Watch macro events:** USD strength, US CPI, Fed rate decisions, and real yields strongly affect silver — they can cause fast moves that blow through technical levels.
* **False breakouts:** Small timeframes can produce fake breakouts; prefer confirmation (close above resistance + follow-through candle).
* **Channel slope changes:** If price chops sideways and slope flattens, the trend may be losing momentum even before a break.
---
# Quick checklist before trading this setup
* Is breakout confirmed by a clean 4-hour close above the box or resistance? ✅
* Is volume / momentum supporting the move? ✅
* Is my stop placed below logical support (not just a random level)? ✅
* Do macro calendars (CPI/Fed/etc.) have events that could spike volatility? ✅
Disclaimer
The information and publications are not meant to be, and do not constitute, financial, investment, trading, or other types of advice or recommendations supplied or endorsed by TradingView. Read more in the Terms of Use.
Disclaimer
The information and publications are not meant to be, and do not constitute, financial, investment, trading, or other types of advice or recommendations supplied or endorsed by TradingView. Read more in the Terms of Use.