In today’s analysis, we focus on Silver (XAG/USD) on the daily timeframe, which is currently presenting a high-probability bearish reversal setup. The price action has completed a Double Top pattern — a classic reversal formation — and has broken down below its neckline support, signaling a potential shift in momentum from bullish to bearish.
This chart setup is particularly valuable for swing traders, pattern traders, and anyone seeking to anticipate mid-term directional moves in the commodities market.
📐 Technical Breakdown:
🔷 1. Double Top Formation:
The Double Top pattern forms after a sustained uptrend and is identified by two peaks at nearly the same level.
In this case:
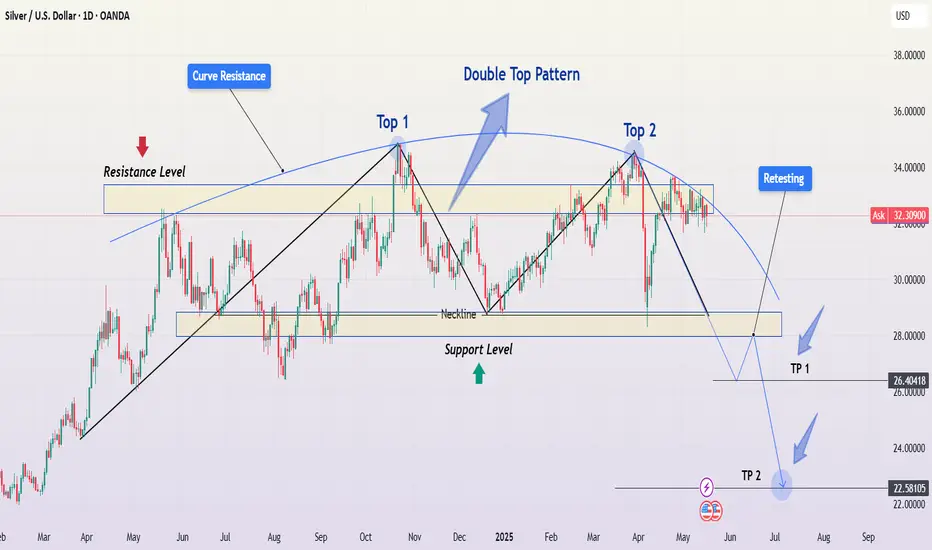
Top 1 formed near $35.5.
Top 2 retested the same zone but failed to break above.
The neckline support — drawn across the $28 zone — was eventually broken.
This price action confirms the classic M-shaped structure, signaling distribution and potential bearish continuation.
🔷 2. Neckline and Breakdown:
After failing at Top 2, price dropped below the neckline, breaking critical horizontal support.
This move completed the pattern, triggering many technical sell signals.
Price is now retesting the neckline zone, a common phenomenon where broken support becomes resistance (known as a "retest").
This retest offers a textbook short opportunity if bearish confirmation follows.
🔷 3. Curve Resistance:
The upper curved blue line represents dynamic resistance.
It has successfully capped price action across multiple attempts and aligns with the pattern's second top — enhancing the strength of this rejection area.
🧱 Support & Resistance Zones:
Resistance Zone: $34.50–$35.50
Strong resistance from both peaks (Top 1 & Top 2) and historical sellers.
Neckline / Retest Zone: ~$28.00
Now acting as resistance — this is the critical level to watch for rejection or breakout.
Support Zones / Take-Profit Levels:
TP1: ~$26.40 — aligns with recent horizontal structure and minor support.
TP2: ~$22.58 — matches major historical support and measured move projection from the Double Top pattern.
📉 Measured Move Target (Pattern Projection):
To calculate the target from a Double Top:
Measure the height from top to neckline.
Project that downward from the neckline’s breakout point.
In this case:
Height: ~$35.5 – $28 = $7.5
Breakdown point: $28 – $7.5 = Target near $20.5–22.5
The TP2 at $22.58 matches this logic — further validating the downside potential.
🔄 Market Psychology & Sentiment:
This pattern reflects a shift in sentiment:
Bulls tried and failed twice to push through resistance.
The eventual breakdown shows bearish conviction, and the ongoing retest represents a decision point.
If sellers hold this level, we could see a cascade of downside pressure as stops are triggered and momentum builds.
🛠️ Trade Setup & Scenarios:
📌 Scenario 1 – Bearish Continuation (High Probability):
If price fails to reclaim the neckline (now resistance) and forms bearish confirmation (e.g., engulfing candle, rejection wick, breakdown below $31), this confirms a likely move toward TP1 and TP2.
Entry Idea: Short on rejection from the $28–$29 zone
Stop-Loss: Above $30
TP1: $26.40
TP2: $22.58
📌 Scenario 2 – Invalidated Pattern:
If bulls push price back above the neckline ($29–$30 zone) with strong volume and daily close, this invalidates the setup and may lead to:
Bullish continuation toward $32–$34
Possible trend resumption if curve resistance breaks
🧠 Educational Notes:
Double Tops are most reliable when:
Formed at the top of strong uptrends.
Followed by a neckline break with volume.
Retested with rejection.
The retest phase is often the best risk/reward entry because:
It confirms resistance.
Offers clear invalidation levels.
Keeps your stop tight while targeting deeper moves.
📢 Final Thoughts:
Silver is currently at a critical technical juncture. The Double Top breakdown has played out, and now all eyes are on the retest. If bears defend the neckline, this setup provides a strong case for continued downside, offering a clean structure with well-defined targets.
⚠️ Risk Management is crucial — always manage your position size and respect invalidation zones.
This chart setup is particularly valuable for swing traders, pattern traders, and anyone seeking to anticipate mid-term directional moves in the commodities market.
📐 Technical Breakdown:
🔷 1. Double Top Formation:
The Double Top pattern forms after a sustained uptrend and is identified by two peaks at nearly the same level.
In this case:
Top 1 formed near $35.5.
Top 2 retested the same zone but failed to break above.
The neckline support — drawn across the $28 zone — was eventually broken.
This price action confirms the classic M-shaped structure, signaling distribution and potential bearish continuation.
🔷 2. Neckline and Breakdown:
After failing at Top 2, price dropped below the neckline, breaking critical horizontal support.
This move completed the pattern, triggering many technical sell signals.
Price is now retesting the neckline zone, a common phenomenon where broken support becomes resistance (known as a "retest").
This retest offers a textbook short opportunity if bearish confirmation follows.
🔷 3. Curve Resistance:
The upper curved blue line represents dynamic resistance.
It has successfully capped price action across multiple attempts and aligns with the pattern's second top — enhancing the strength of this rejection area.
🧱 Support & Resistance Zones:
Resistance Zone: $34.50–$35.50
Strong resistance from both peaks (Top 1 & Top 2) and historical sellers.
Neckline / Retest Zone: ~$28.00
Now acting as resistance — this is the critical level to watch for rejection or breakout.
Support Zones / Take-Profit Levels:
TP1: ~$26.40 — aligns with recent horizontal structure and minor support.
TP2: ~$22.58 — matches major historical support and measured move projection from the Double Top pattern.
📉 Measured Move Target (Pattern Projection):
To calculate the target from a Double Top:
Measure the height from top to neckline.
Project that downward from the neckline’s breakout point.
In this case:
Height: ~$35.5 – $28 = $7.5
Breakdown point: $28 – $7.5 = Target near $20.5–22.5
The TP2 at $22.58 matches this logic — further validating the downside potential.
🔄 Market Psychology & Sentiment:
This pattern reflects a shift in sentiment:
Bulls tried and failed twice to push through resistance.
The eventual breakdown shows bearish conviction, and the ongoing retest represents a decision point.
If sellers hold this level, we could see a cascade of downside pressure as stops are triggered and momentum builds.
🛠️ Trade Setup & Scenarios:
📌 Scenario 1 – Bearish Continuation (High Probability):
If price fails to reclaim the neckline (now resistance) and forms bearish confirmation (e.g., engulfing candle, rejection wick, breakdown below $31), this confirms a likely move toward TP1 and TP2.
Entry Idea: Short on rejection from the $28–$29 zone
Stop-Loss: Above $30
TP1: $26.40
TP2: $22.58
📌 Scenario 2 – Invalidated Pattern:
If bulls push price back above the neckline ($29–$30 zone) with strong volume and daily close, this invalidates the setup and may lead to:
Bullish continuation toward $32–$34
Possible trend resumption if curve resistance breaks
🧠 Educational Notes:
Double Tops are most reliable when:
Formed at the top of strong uptrends.
Followed by a neckline break with volume.
Retested with rejection.
The retest phase is often the best risk/reward entry because:
It confirms resistance.
Offers clear invalidation levels.
Keeps your stop tight while targeting deeper moves.
📢 Final Thoughts:
Silver is currently at a critical technical juncture. The Double Top breakdown has played out, and now all eyes are on the retest. If bears defend the neckline, this setup provides a strong case for continued downside, offering a clean structure with well-defined targets.
⚠️ Risk Management is crucial — always manage your position size and respect invalidation zones.
Related publications
Disclaimer
The information and publications are not meant to be, and do not constitute, financial, investment, trading, or other types of advice or recommendations supplied or endorsed by TradingView. Read more in the Terms of Use.
Related publications
Disclaimer
The information and publications are not meant to be, and do not constitute, financial, investment, trading, or other types of advice or recommendations supplied or endorsed by TradingView. Read more in the Terms of Use.