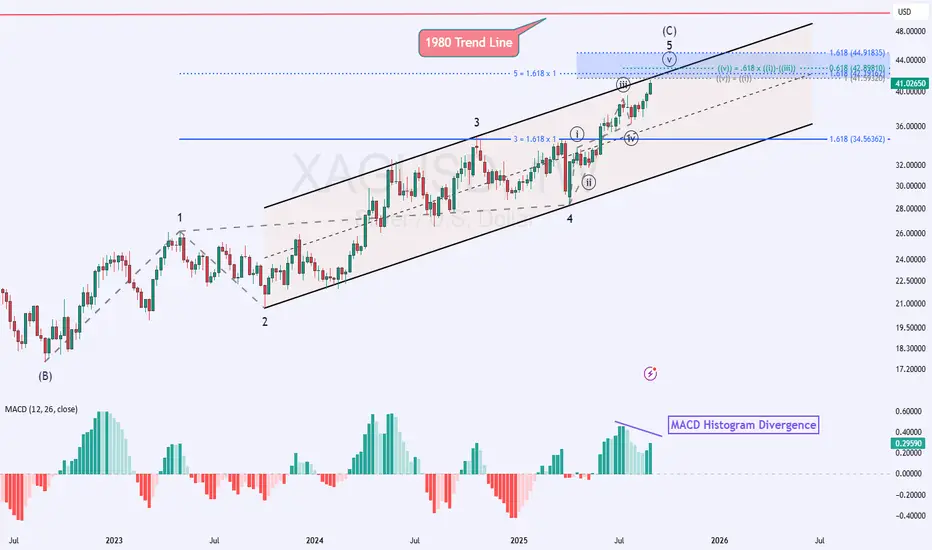
Silver has rallied nearly 45% from the April low reaching $41/oz. Silver prices can now see a very long-term trend line connecting the 1980 and 2011 price highs, a 45-year trend line in the making. (red line)
If Silver were to rally that high, a bearish reaction would likely be felt.
However, Silver has a wall of Elliott wave relationships and market geometry it needs to contend with first.
The rally from the September 2022 low is quite mature from an Elliott wave perspective. The rally is unfolding as an impulse wave pattern labeled 1-2-3-4-5 and it appears Silver is in the late stages of wave 5.
Wave 5 would need to subdivide as 5-waves and current prices appear to have completed wave ((iv)) at the July 31 low.
If this wave labeling is correct, then Silver is in wave ((v)) of 5 of (C)...an ending wave at 3 degrees of trend.
We can use common wave relationships and market geometry measurements to estimate where this current up wave may travel to.
There is a cluster of wave relationships between 41.59 - 44.92 plus a parallel price channel to help hold down Silver.
Lastly, there is some histogram divergence noted on the MACD indicator.
All of these symptoms mixed together suggest rallies in Silver may be limited with the bulk of the trend behind it.
IF this is correct, then another down-up sequence may finish silver off and lead to a decline back to the wave 4 extreme, near $29.
Though not expected, if silver does plow above $44.92, then the 1980 trend line will likely offer a bearish reaction.
Disclaimer
The information and publications are not meant to be, and do not constitute, financial, investment, trading, or other types of advice or recommendations supplied or endorsed by TradingView. Read more in the Terms of Use.
Disclaimer
The information and publications are not meant to be, and do not constitute, financial, investment, trading, or other types of advice or recommendations supplied or endorsed by TradingView. Read more in the Terms of Use.