Brent jumps 5.5 %, bullion hits fresh records, but analysts still see $65 crude by Q4 if key shipping lanes stay open
The crude-oil market loves nothing more than a geopolitical headline, and the one that flashed across terminals this past weekend was a whopper: escalating hostilities between Israel and Iran. Within minutes of the first wire stories, Brent crude vaulted 5.5 % to an intraday high of $76.02 a barrel—its largest single-session pop since Russia invaded Ukraine in early 2022—before giving back part of the gain to settle just under $76. West Texas Intermediate (WTI) traced a similar arc, peaking at $74.11 and closing fractionally lower.
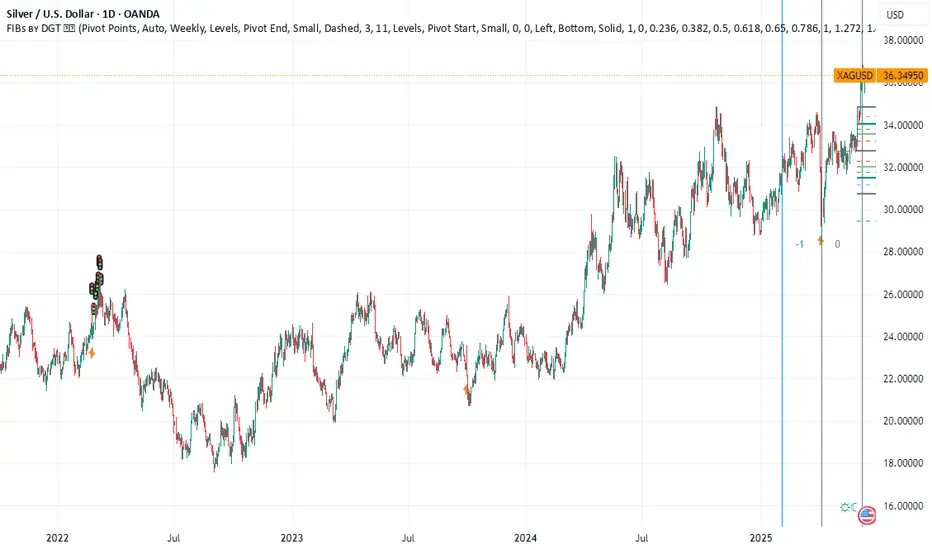
At the same time, investors stampeded into traditional havens. COMEX gold pierced $2,450 an ounce for the first time, while silver sprinted above $33—blowing past the decade-old high set during the meme-metal frenzy of 2021. The twin moves in energy and precious metals underscore how fragile risk sentiment has become even as global demand growth, OPEC discipline, and U.S. shale resilience point to a more balanced physical market later this year.
Below we dissect the drivers of crude’s latest surge, explore the scenarios that could push prices back toward—or away from—the $65 handle by the fourth quarter, and explain why bullion refuses to loosen its grip on record territory.
________________________________________
1. What Sparked the Spike?
1. Tit-for-tat escalation. Reports of Israel striking Iran-linked assets in Syria and Iran responding with drone attacks near the Golan Heights raised fears of a direct Israel-Iran confrontation—a worst-case scenario that could spill into the Strait of Hormuz and threaten 20 % of global seaborne oil.
2. Thin pre-holiday liquidity. Monday volume was 30 % below the 20-day average with several Asian markets closed, exaggerating price swings and triggering momentum-chasing algos.
3. Options market gamma squeeze. Dealers short upside calls scrambled to hedge as spot pierced $75, accelerating the melt-up. Open interest in $80 Brent calls expiring in June ballooned to 45,000 contracts—four times the 3-month norm.
________________________________________
2. How Real Is the Supply Risk?
While the headlines are chilling, physical flows remain intact for now:
• Strait of Hormuz: No tankers have been impeded, insurance premia have widened only 25 ¢ per barrel—well below the $3 spike seen after the 2019 Abqaiq attack in Saudi Arabia.
• Iraqi-Turkish Pipeline: Still shuttered for unrelated legal reasons; volumes have been offline since March 2023 and are therefore “priced in.”
• Suez Canal / SUMED: Egyptian authorities report normal operations.
In short, the rally is risk premia, not actual barrels lost. That distinction matters because premia tend to deflate quickly once tension plateaus, as the market witnessed in October 2023 after Hamas’s initial assault on Israel.
________________________________________
3. Fundamentals Point to Softer Prices by Autumn
Four forces could push Brent back into the $65–68 corridor by Q4 2025 if the geopolitical situation stabilizes:
Force Current Status Q3–Q4 Outlook
OPEC+ Spare Capacity ~5.5 mbpd, most in Saudi/UAE
Ability to add 1–2 mbpd if prices spike
U.S. Shale Growth 13.3 mbpd, record high +0.6 mbpd y/y, breakeven $47–55
Refinery Maintenance Peak spring turnarounds remove 1.5 mbpd demand Units restart by July, easing crude tightness
Global Demand +1.2 mbpd y/y (IEA) Slows to +0.8 mbpd on OECD weakness
Add seasonal gasoline demand ebbing after August, and the supply-demand balance tilts looser just as futures curves roll into Q1 2026 deliveries—a period typically beset by refinery slowdowns and holiday travel lulls.
________________________________________
4. Scenario Analysis: Three Paths for Brent
1. Escalation (20 % probability)
• Direct Israeli strike on Iranian territory → Tehran targets Hormuz traffic
• 3 mbpd disrupted for one month
• Brent overshoots to $100+, backwardation widens above $10
• Biden releases 90 mb from the SPR; OPEC signals emergency meeting
2. Containment (60 % probability)
• Hostilities remain proxy-based in Syria/Lebanon; shipping unscathed
• Risk premium bleeds off; Brent drifts to $70–72 by July
• By Q4 oversupply emerges; prices test $65
3. Detente (20 % probability)
• U.S.-mediated cease-fire; hostages exchanged
• Iran de-escalates to focus on reviving JCPOA talks
• Risk premium collapses; Brent revisits mid-$60s by August and low-$60s into winter
________________________________________
5. Why Gold and Silver Are On Fire
The precious-metals rally is less about oil and more about real yields and central-bank buying:
• Real 10-year U.S. yield sits at 1.05 %, down from 1.55 % in February, boosting gold’s carry cost competitiveness.
• PBoC & EM central banks added a net 23 tonnes in April—the 17th straight month of net purchases.
• ETF inflows turned positive for the first time in nine months, adding 14 tonnes last week.
Silver benefits from the same macro tailwinds plus industrial demand (solar panel capacity is growing 45 % y/y). A tight COMEX inventory cover ratio—registered stocks equal to just 1.4 months of offtake—amplifies price sensitivity.
________________________________________
6. Cross-Asset Implications
1. Equities: Energy stocks (XLE) outperformed the S&P 500 by 3 % intraday but could retrace if crude fizzles. Miners (GDX, SILJ) may enjoy more durable momentum given new-high psychology.
2. FX: Petro-currencies CAD and NOK rallied 0.4 % vs. USD; safe-haven CHF gained 0.3 %. JPY failed to catch a bid, reflecting carry-trade dominance.
3. Rates: U.S. 2-year yields slipped 6 bp as Fed cut odds edged up on stagflation fears, but the move lacked conviction.
________________________________________
7. What Could Invalidate the Bearish Q4 Call?
• OPEC+ Discipline Frays: If Saudi Arabia tires of single-handedly absorbing cuts and opens the taps, prices could undershoot $60—but Riyadh’s fiscal breakeven (~$82) makes this unlikely.
• U.S. Election Politics: A new White House may re-impose harsher sanctions on Iran or ease drilling restrictions, tilting balances either way.
• Extreme Weather: An intense Atlantic hurricane season could knock Gulf of Mexico output offline, squeezing physical supply just as refineries demand more feedstock.
________________________________________
8. Trading and Hedging Playbook
Asset Bias Vehicles Key Levels
Brent Crude Fade rallies toward $80; target $68 by Oct ICE futures, Jul $70 puts Resistance $78.80 / Support $71.30
WTI Similar to Brent NYMEX CL, calendar-spread (long Dec 24, short Dec 25) Resistance $75.20
Gold Buy dips if real yields fall below 0.9 % Futures, GLD ETF, 25-delta call spreads Support $2,390
Silver Momentum long until $35; tighten stops Futures, SLV ETF, 2-month $34 calls Resistance $36.20
Energy Equities Pair trade: long refiners vs. short E&Ps ETFs: CRAK vs. XOP Watch crack spreads
Risk managers should recall that correlation spikes under stress: a portfolio long gold and short crude looks diversified—until a Middle-East cease-fire nukes both legs.
________________________________________
9. Macro Backdrop: Demand Still Fragile
Even before the flare-up, oil demand forecasts were slipping:
• OECD: Eurozone PMIs languish below 50; German diesel demand –7 % y/y.
• China: Q2 refinery runs flatlining; teapot margins < $2/bbl.
• India: Bright spot with gasoline demand +9 %, but monsoon season will clip growth.
On the supply side, non-OPEC production is rising 1.8 mbpd this year, led by Brazil’s pre-salt, Guyana’s Stabroek block, and U.S. Permian efficiency gains. Unless Middle-East barrels exit the market, the call on OPEC crude will shrink from 28 mbpd in Q2 to 26.7 mbpd in Q4, forcing the cartel to decide between market share and price.
________________________________________
10. Historical Perspective: Geopolitical Risk Premiums Fade Fast
Event Initial Brent Jump Days to Round-Trip Barrels Lost?
2019 Abqaiq Attack +15 % 38 < 0.2 mbpd for 30 days
2020 U.S.–Iran (Soleimani) +5 % 10 None
2022 Russia-Ukraine +35 % Still elevated > 1 mbpd rerouted
Based on precedent, a 5–7 % surge without real supply disruption typically unwinds within six weeks.
________________________________________
11. Outlook Summary
• Base Case: Containment; Brent averages $70–72 through summer, melts to $65–68 Q4. Gold consolidates above $2,350; silver churns $30–34.
• Bull Case (Oil): Hormuz threatened; Brent $100+, gas prices soar, Fed forced to juggle inflation vs. growth.
• Bear Case (Oil): Cease-fire + soft demand; Brent breaks $60, OPEC+ grapples with fresh round of cuts.
•
________________________________________
12. Conclusion
The Israel-Iran flashpoint has injected a fresh geopolitical premium into oil and turbo-charged safe-haven metals, but history suggests emotion-driven rallies fade quickly when physical barrels keep flowing. Unless missiles land near Hormuz or an errant drone strikes a Saudi export terminal, the structural forces of rising non-OPEC supply and cooling demand should reassert themselves, dragging Brent back toward the mid-$60s by year-end.
For traders, that means respecting the tape today but planning for mean reversion tomorrow—selling gamma-rich call structures in crude, rolling stop-losses higher on bullion longs, and watching like hawks for any hint that shipping lanes are no longer merely a headline risk but a tangible bottleneck. Until that line is crossed, the smart money will treat each price spike not as the dawn of $100 crude, but as an opportunity to hedge, fade, and position for a calmer, cheaper barrel in the months ahead.
The crude-oil market loves nothing more than a geopolitical headline, and the one that flashed across terminals this past weekend was a whopper: escalating hostilities between Israel and Iran. Within minutes of the first wire stories, Brent crude vaulted 5.5 % to an intraday high of $76.02 a barrel—its largest single-session pop since Russia invaded Ukraine in early 2022—before giving back part of the gain to settle just under $76. West Texas Intermediate (WTI) traced a similar arc, peaking at $74.11 and closing fractionally lower.
At the same time, investors stampeded into traditional havens. COMEX gold pierced $2,450 an ounce for the first time, while silver sprinted above $33—blowing past the decade-old high set during the meme-metal frenzy of 2021. The twin moves in energy and precious metals underscore how fragile risk sentiment has become even as global demand growth, OPEC discipline, and U.S. shale resilience point to a more balanced physical market later this year.
Below we dissect the drivers of crude’s latest surge, explore the scenarios that could push prices back toward—or away from—the $65 handle by the fourth quarter, and explain why bullion refuses to loosen its grip on record territory.
________________________________________
1. What Sparked the Spike?
1. Tit-for-tat escalation. Reports of Israel striking Iran-linked assets in Syria and Iran responding with drone attacks near the Golan Heights raised fears of a direct Israel-Iran confrontation—a worst-case scenario that could spill into the Strait of Hormuz and threaten 20 % of global seaborne oil.
2. Thin pre-holiday liquidity. Monday volume was 30 % below the 20-day average with several Asian markets closed, exaggerating price swings and triggering momentum-chasing algos.
3. Options market gamma squeeze. Dealers short upside calls scrambled to hedge as spot pierced $75, accelerating the melt-up. Open interest in $80 Brent calls expiring in June ballooned to 45,000 contracts—four times the 3-month norm.
________________________________________
2. How Real Is the Supply Risk?
While the headlines are chilling, physical flows remain intact for now:
• Strait of Hormuz: No tankers have been impeded, insurance premia have widened only 25 ¢ per barrel—well below the $3 spike seen after the 2019 Abqaiq attack in Saudi Arabia.
• Iraqi-Turkish Pipeline: Still shuttered for unrelated legal reasons; volumes have been offline since March 2023 and are therefore “priced in.”
• Suez Canal / SUMED: Egyptian authorities report normal operations.
In short, the rally is risk premia, not actual barrels lost. That distinction matters because premia tend to deflate quickly once tension plateaus, as the market witnessed in October 2023 after Hamas’s initial assault on Israel.
________________________________________
3. Fundamentals Point to Softer Prices by Autumn
Four forces could push Brent back into the $65–68 corridor by Q4 2025 if the geopolitical situation stabilizes:
Force Current Status Q3–Q4 Outlook
OPEC+ Spare Capacity ~5.5 mbpd, most in Saudi/UAE
Ability to add 1–2 mbpd if prices spike
U.S. Shale Growth 13.3 mbpd, record high +0.6 mbpd y/y, breakeven $47–55
Refinery Maintenance Peak spring turnarounds remove 1.5 mbpd demand Units restart by July, easing crude tightness
Global Demand +1.2 mbpd y/y (IEA) Slows to +0.8 mbpd on OECD weakness
Add seasonal gasoline demand ebbing after August, and the supply-demand balance tilts looser just as futures curves roll into Q1 2026 deliveries—a period typically beset by refinery slowdowns and holiday travel lulls.
________________________________________
4. Scenario Analysis: Three Paths for Brent
1. Escalation (20 % probability)
• Direct Israeli strike on Iranian territory → Tehran targets Hormuz traffic
• 3 mbpd disrupted for one month
• Brent overshoots to $100+, backwardation widens above $10
• Biden releases 90 mb from the SPR; OPEC signals emergency meeting
2. Containment (60 % probability)
• Hostilities remain proxy-based in Syria/Lebanon; shipping unscathed
• Risk premium bleeds off; Brent drifts to $70–72 by July
• By Q4 oversupply emerges; prices test $65
3. Detente (20 % probability)
• U.S.-mediated cease-fire; hostages exchanged
• Iran de-escalates to focus on reviving JCPOA talks
• Risk premium collapses; Brent revisits mid-$60s by August and low-$60s into winter
________________________________________
5. Why Gold and Silver Are On Fire
The precious-metals rally is less about oil and more about real yields and central-bank buying:
• Real 10-year U.S. yield sits at 1.05 %, down from 1.55 % in February, boosting gold’s carry cost competitiveness.
• PBoC & EM central banks added a net 23 tonnes in April—the 17th straight month of net purchases.
• ETF inflows turned positive for the first time in nine months, adding 14 tonnes last week.
Silver benefits from the same macro tailwinds plus industrial demand (solar panel capacity is growing 45 % y/y). A tight COMEX inventory cover ratio—registered stocks equal to just 1.4 months of offtake—amplifies price sensitivity.
________________________________________
6. Cross-Asset Implications
1. Equities: Energy stocks (XLE) outperformed the S&P 500 by 3 % intraday but could retrace if crude fizzles. Miners (GDX, SILJ) may enjoy more durable momentum given new-high psychology.
2. FX: Petro-currencies CAD and NOK rallied 0.4 % vs. USD; safe-haven CHF gained 0.3 %. JPY failed to catch a bid, reflecting carry-trade dominance.
3. Rates: U.S. 2-year yields slipped 6 bp as Fed cut odds edged up on stagflation fears, but the move lacked conviction.
________________________________________
7. What Could Invalidate the Bearish Q4 Call?
• OPEC+ Discipline Frays: If Saudi Arabia tires of single-handedly absorbing cuts and opens the taps, prices could undershoot $60—but Riyadh’s fiscal breakeven (~$82) makes this unlikely.
• U.S. Election Politics: A new White House may re-impose harsher sanctions on Iran or ease drilling restrictions, tilting balances either way.
• Extreme Weather: An intense Atlantic hurricane season could knock Gulf of Mexico output offline, squeezing physical supply just as refineries demand more feedstock.
________________________________________
8. Trading and Hedging Playbook
Asset Bias Vehicles Key Levels
Brent Crude Fade rallies toward $80; target $68 by Oct ICE futures, Jul $70 puts Resistance $78.80 / Support $71.30
WTI Similar to Brent NYMEX CL, calendar-spread (long Dec 24, short Dec 25) Resistance $75.20
Gold Buy dips if real yields fall below 0.9 % Futures, GLD ETF, 25-delta call spreads Support $2,390
Silver Momentum long until $35; tighten stops Futures, SLV ETF, 2-month $34 calls Resistance $36.20
Energy Equities Pair trade: long refiners vs. short E&Ps ETFs: CRAK vs. XOP Watch crack spreads
Risk managers should recall that correlation spikes under stress: a portfolio long gold and short crude looks diversified—until a Middle-East cease-fire nukes both legs.
________________________________________
9. Macro Backdrop: Demand Still Fragile
Even before the flare-up, oil demand forecasts were slipping:
• OECD: Eurozone PMIs languish below 50; German diesel demand –7 % y/y.
• China: Q2 refinery runs flatlining; teapot margins < $2/bbl.
• India: Bright spot with gasoline demand +9 %, but monsoon season will clip growth.
On the supply side, non-OPEC production is rising 1.8 mbpd this year, led by Brazil’s pre-salt, Guyana’s Stabroek block, and U.S. Permian efficiency gains. Unless Middle-East barrels exit the market, the call on OPEC crude will shrink from 28 mbpd in Q2 to 26.7 mbpd in Q4, forcing the cartel to decide between market share and price.
________________________________________
10. Historical Perspective: Geopolitical Risk Premiums Fade Fast
Event Initial Brent Jump Days to Round-Trip Barrels Lost?
2019 Abqaiq Attack +15 % 38 < 0.2 mbpd for 30 days
2020 U.S.–Iran (Soleimani) +5 % 10 None
2022 Russia-Ukraine +35 % Still elevated > 1 mbpd rerouted
Based on precedent, a 5–7 % surge without real supply disruption typically unwinds within six weeks.
________________________________________
11. Outlook Summary
• Base Case: Containment; Brent averages $70–72 through summer, melts to $65–68 Q4. Gold consolidates above $2,350; silver churns $30–34.
• Bull Case (Oil): Hormuz threatened; Brent $100+, gas prices soar, Fed forced to juggle inflation vs. growth.
• Bear Case (Oil): Cease-fire + soft demand; Brent breaks $60, OPEC+ grapples with fresh round of cuts.
•
________________________________________
12. Conclusion
The Israel-Iran flashpoint has injected a fresh geopolitical premium into oil and turbo-charged safe-haven metals, but history suggests emotion-driven rallies fade quickly when physical barrels keep flowing. Unless missiles land near Hormuz or an errant drone strikes a Saudi export terminal, the structural forces of rising non-OPEC supply and cooling demand should reassert themselves, dragging Brent back toward the mid-$60s by year-end.
For traders, that means respecting the tape today but planning for mean reversion tomorrow—selling gamma-rich call structures in crude, rolling stop-losses higher on bullion longs, and watching like hawks for any hint that shipping lanes are no longer merely a headline risk but a tangible bottleneck. Until that line is crossed, the smart money will treat each price spike not as the dawn of $100 crude, but as an opportunity to hedge, fade, and position for a calmer, cheaper barrel in the months ahead.
Get your free C++ High Frequency Trading ebook at
quantlabsnet.com/registration
Or talk me live 1 on 1 at wa.me/16477809447?text=Hi I saw you on TradingView and I got questions
quantlabsnet.com/registration
Or talk me live 1 on 1 at wa.me/16477809447?text=Hi I saw you on TradingView and I got questions
Related publications
Disclaimer
The information and publications are not meant to be, and do not constitute, financial, investment, trading, or other types of advice or recommendations supplied or endorsed by TradingView. Read more in the Terms of Use.