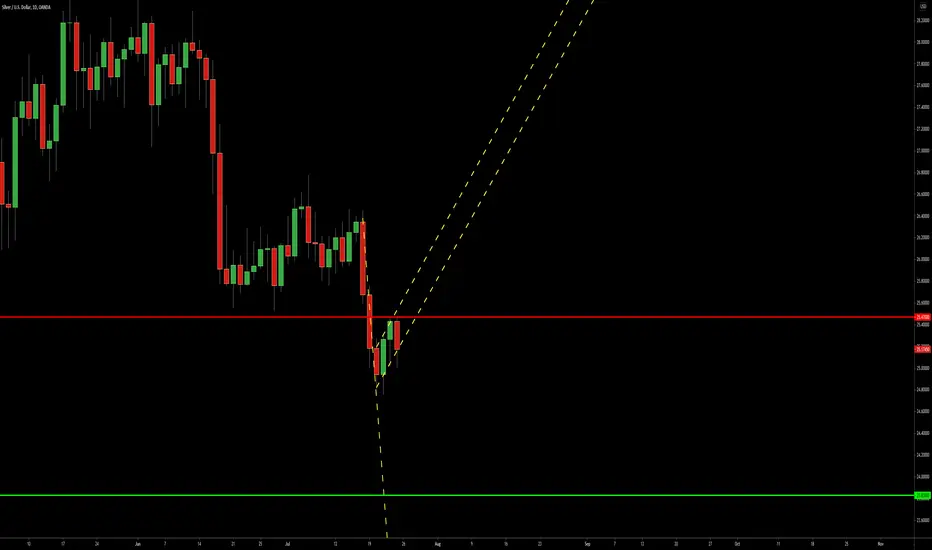
You can see a bearish flag on the XAG/USD (Silver) daily chart. It offers a downside breakout trading setup. The flag and its pole are shown with the yellow lines. My potential take-profit level is marked with the green line. My potential stop-loss level is marked with the red line. It is best to wait for a close reasonably below the lower border of the flag area to initiate a sell trade.
Trade active
Entry triggered on 28.07 at 00:01 at 24.735 with SL = 25.470, TP = 23.830.Trade closed: stop reached
SL reached on 29.07 at 8:22 UTC.You can find useful tools to detect, build, and trade chart patterns - all completely free on earnforex.com.
Disclaimer
The information and publications are not meant to be, and do not constitute, financial, investment, trading, or other types of advice or recommendations supplied or endorsed by TradingView. Read more in the Terms of Use.
You can find useful tools to detect, build, and trade chart patterns - all completely free on earnforex.com.
Disclaimer
The information and publications are not meant to be, and do not constitute, financial, investment, trading, or other types of advice or recommendations supplied or endorsed by TradingView. Read more in the Terms of Use.