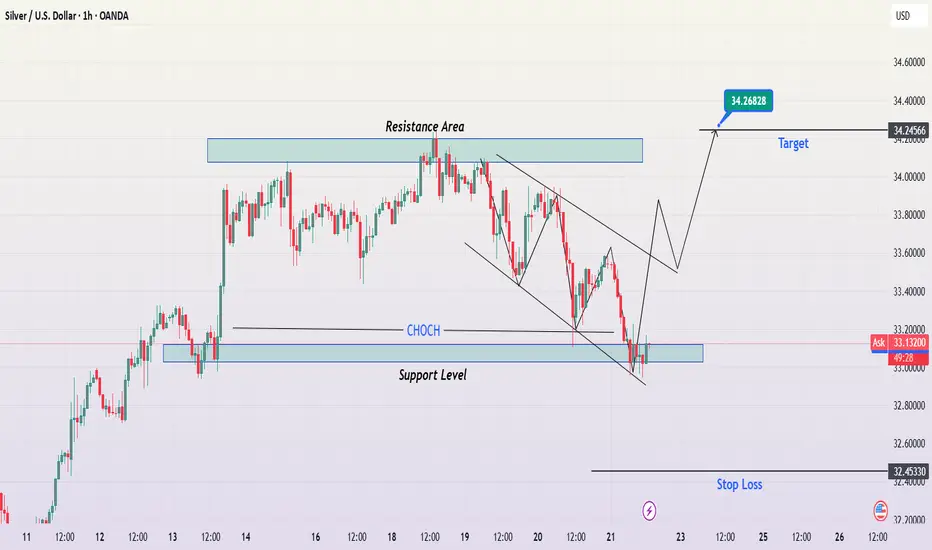
This analysis presents a high-probability bullish trade setup based on key price action principles, market structure, and technical indicators. The chart illustrates a potential reversal from a support zone, a descending channel breakout, and an overall shift in trend dynamics.
1. Market Structure & Key Price Levels
Before placing any trade, it's essential to analyze the bigger picture, including support and resistance levels, trend structure, and liquidity zones. Let's break down the key areas:
A. Resistance Area (Supply Zone) – $34.20 to $34.60
This horizontal resistance zone has historically acted as a selling pressure area where price faced rejection.
It represents a profit-taking zone for bulls and a possible reversal point for bears.
If price successfully breaks and closes above this resistance, it could signal further upside potential.
B. Support Level (Demand Zone) – $32.90 to $33.10
The price has consistently bounced from this region, indicating strong buying interest.
This level has acted as a demand zone, where institutions or large traders are likely accumulating positions.
A strong bullish reaction from this zone strengthens the reversal scenario.
C. Change of Character (CHoCH) – Key Structural Shift
A Change of Character (CHoCH) is marked on the chart, indicating a potential shift from a bearish to a bullish trend.
This is one of the most reliable signals when transitioning from a downtrend to an uptrend.
2. Chart Pattern & Price Action Analysis
A. Descending Channel Formation (Bullish Reversal Pattern)
The market has been forming a descending channel, which is a corrective pattern rather than a continuation pattern.
This structure consists of lower highs and lower lows, indicating short-term selling pressure.
However, when such a pattern forms near strong support, it often precedes a breakout and trend reversal.
A confirmed break above the channel's upper trendline will serve as a bullish breakout signal.
B. Liquidity Grab & Stop Hunt Consideration
Many retail traders place stop-loss orders below the support zone, making it an area of liquidity accumulation.
The market may attempt to sweep these stops before moving up, which aligns with institutional trading behavior.
If price momentarily dips below the support and then quickly reverses with strong bullish momentum, it confirms a stop hunt and a possible reversal setup.
3. Trading Strategy & Setup
To maximize profits while managing risk, we need a well-structured entry, target, and stop-loss strategy.
📌 Entry Strategy
Aggressive Entry:
Enter a buy position within the support zone ($33.00 - $33.10) if bullish price action (e.g., bullish engulfing candle) confirms buying pressure.
Conservative Entry:
Wait for a clear breakout from the descending channel’s upper trendline, then buy on a retest.
This reduces the risk of a fakeout and provides higher confirmation.
🎯 Target Levels (Take Profit Zones)
First Target (TP1) – $34.26
This is a key resistance level where price previously reversed.
Partial profit-taking is recommended here to secure gains.
Second Target (TP2) – $34.60
If momentum continues, price could reach this extended target.
Strong breakout volume would support this move.
🛑 Stop Loss (SL) Placement
Stop-loss should be set below the support zone ($32.45).
This ensures adequate risk management and avoids premature stop-outs.
If price breaks below this level with strong selling volume, the bullish setup is invalidated.
4. Risk Management & Trade Considerations
📌 Risk-to-Reward Ratio (RRR):
The trade setup offers an RRR of at least 1:3, making it a high-probability trade.
📌 Possible Fakeouts & Confirmation Signals:
If price breaks above the descending channel but fails to hold above support, it's a sign of a fake breakout.
Watch for strong bullish volume and clear break of previous lower highs before entering long.
📌 Fundamental Factors:
Keep an eye on economic reports, Federal Reserve speeches, and USD strength, as they heavily influence Silver prices.
5. Conclusion – High-Probability Bullish Setup
Descending channel breakout, strong support level, and CHoCH indicate a potential bullish reversal.
If buyers successfully defend the support zone, price is likely to target $34.26 – $34.60.
Risk management is crucial – waiting for confirmation reduces chances of a failed trade.
🚀 Watch for bullish confirmation before entering!
For Daily Trade Setups and Forecast: 📈 t.me/xauusdoptimizer
Premium Signals Fr33: 💯 t.me/xauusdoptimizer
🥰🥳🤩
Premium Signals Fr33: 💯 t.me/xauusdoptimizer
🥰🥳🤩
Related publications
Disclaimer
The information and publications are not meant to be, and do not constitute, financial, investment, trading, or other types of advice or recommendations supplied or endorsed by TradingView. Read more in the Terms of Use.