📈 Chart Summary:
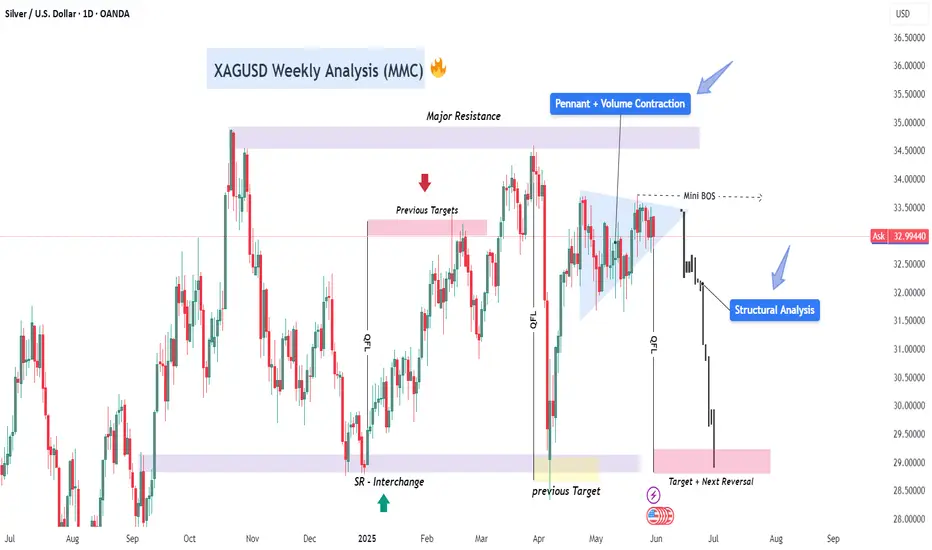
The chart shows the price action of Silver (XAG/USD) on the daily timeframe, capturing a significant shift in market sentiment. This analysis is based on the MMC (Market Maker Cycle) concept and a combination of Smart Money Concepts, Pennant Structure, and Volume Contraction patterns.
Over the past weeks, XAGUSD has transitioned from accumulation and markup to distribution and markdown, suggesting that smart money has exited long positions and is now pushing price toward discount zones for future reaccumulation.
🔍 Detailed Breakdown:
🔹 1. Major Resistance Area – The Selling Origin
At the top of the chart, we see a major resistance zone near $35–$36, which acted as a structural ceiling for months. Each time price approached this area, sellers stepped in aggressively, rejecting price and creating long wicks.
This level represents institutional supply—where big players offload positions, often leaving a liquidity trail behind for later use.
🔹 2. Pennant Formation + Volume Contraction – Classic Distribution
From late April to mid-May, Silver formed a pennant structure, a well-known consolidation pattern. What's special here is the volume contraction—a subtle clue that buyers are drying up while sellers prepare for a large move.
This is a classic Wyckoff distribution behavior:
Buyers are lured in as price moves in a tight range.
Breakout traders enter early expecting a bullish continuation.
Institutions trap liquidity before dumping price into inefficiency.
The mini Break of Structure (BOS) to the upside acted as a false breakout, perfectly engineered to trap liquidity above the pennant.
🔹 3. Structural Breakdown – Momentum Shifts Bearish
Once the trap was complete, price reversed with strong momentum, breaking past key supports and violating internal structure. The label "Structural Analysis" marks the beginning of this break in market structure, confirming the change in character.
This shift aligns with Smart Money’s "Manipulation → Distribution → Expansion" logic.
We also note how price broke below the SR-interchange zone, where support became resistance—a powerful reversal confirmation.
🔹 4. Target + Next Reversal Zone – The Magnet
Currently, Silver is headed toward the $29–$28 zone, highlighted in red as the "Target + Next Reversal" area.
This level has high confluence:
Acts as a previous QFL (Quasimodo Failure Level).
Has unmitigated demand.
Matches with earlier lows where smart money likely accumulated positions.
Here, we can expect either a strong bounce or short-term consolidation before the next directional move.
📌 Confluence Zones:
Key Zone Significance
$35–$36 Major Resistance (Supply / Exit zone)
$33.5 Mini BOS & Liquidity Trap Area
$31.8 – $32.5 Structural Break Zone (Old Demand Broken)
$29 – $28 Target + Reversal (High Confluence Zone)
🧠 Smart Money Perspective:
This entire sequence is not random—it’s engineered.
Institutions:
Collected orders at the bottom.
Pushed price up to resistance.
Consolidated in a pennant to build liquidity.
Triggered a false breakout to trap late buyers.
Dumped aggressively, targeting previous lows for re-entry.
This is the Market Maker Cycle in action — and we’re in the Distribution to Markdown phase right now.
🎯 Trading Plan:
Short-Term Bias: Bearish until $29–$28 is reached.
Swing Traders: Look for signs of reversal in the $28–$29 zone (bullish engulfing, FVG fill, or demand reactivation).
Day Traders: Watch for pullbacks to the $32.5–$33 resistance zone to enter continuation shorts.
🧵 Final Thoughts:
This is a textbook example of how Smart Money manipulates structure, traps liquidity, and moves price in phases. Patterns like pennants, BOS, and SR flips, when combined with volume and context, give us clear directional bias.
If you're still chasing the breakout without understanding the setup behind it, you're trading against those who engineered the move. Understand the structure — or get trapped by it.
For Daily Trade Setups and Forecast: 📈 t.me/xauusdoptimizer
Premium Signals Fr33: 💯 t.me/xauusdoptimizer
🥰🥳🤩
Premium Signals Fr33: 💯 t.me/xauusdoptimizer
🥰🥳🤩
Related publications
Disclaimer
The information and publications are not meant to be, and do not constitute, financial, investment, trading, or other types of advice or recommendations supplied or endorsed by TradingView. Read more in the Terms of Use.