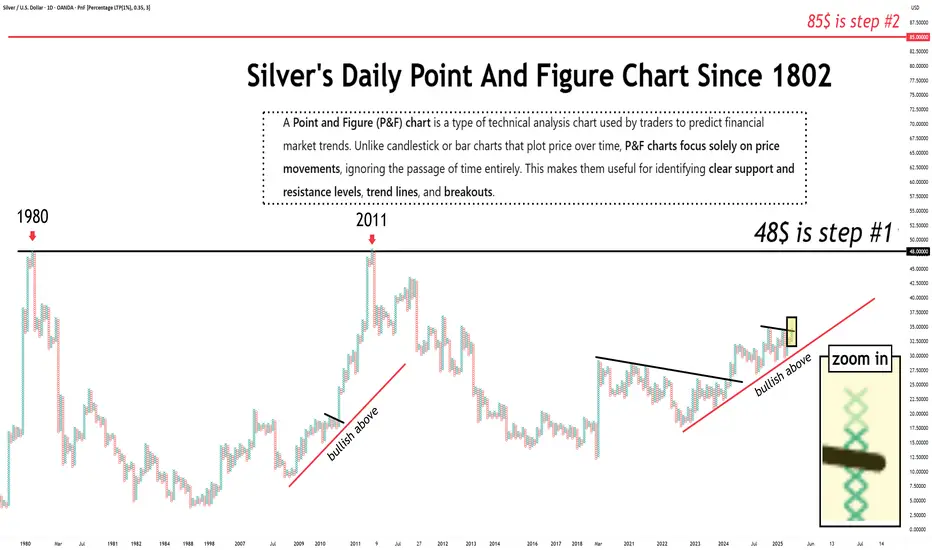
A Point and Figure (P&F) chart is a type of technical analysis chart used by traders to predict financial market trends. Unlike candlestick or bar charts that plot price over time, P&F charts focus solely on price movements, ignoring the passage of time entirely. This makes them useful for identifying clear support and resistance levels, trend lines, and breakouts. --chatgpt
✅Industry-leading technical analysis
✅Market commentary
✅Trade Tracker
✅Podcast Reviews
Use discount code "TRADINGVIEW" and get a lifetime 50% discount on PREMIUM plans
🔗northstarbadcharts.com/
✅Market commentary
✅Trade Tracker
✅Podcast Reviews
Use discount code "TRADINGVIEW" and get a lifetime 50% discount on PREMIUM plans
🔗northstarbadcharts.com/
Disclaimer
The information and publications are not meant to be, and do not constitute, financial, investment, trading, or other types of advice or recommendations supplied or endorsed by TradingView. Read more in the Terms of Use.