📊 Overview of the Chart
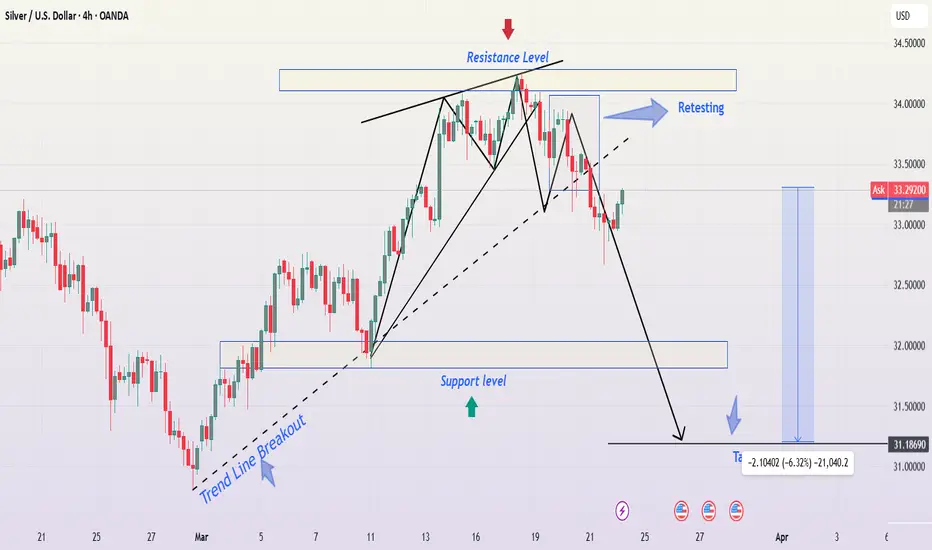
This 4-hour chart of Silver (XAG/USD) provides a classic example of a Rising Wedge Breakdown, a bearish reversal pattern. The price initially followed a strong uptrend, forming a series of higher highs and higher lows, but failed to sustain momentum at the key resistance zone (~$34.00 - $34.50). This led to a breakout to the downside, which has now confirmed a shift in market sentiment from bullish to bearish.
This analysis will break down each key level, the technical indicators supporting this trade setup, and how traders can approach it effectively.
🛠️ Breakdown of the Chart Components
1️⃣ Rising Wedge Formation (Bearish Pattern Identified)
The price action created a Rising Wedge, which is a bearish pattern characterized by an uptrend where the higher highs and higher lows start converging into a narrowing range.
This shows that while buyers were pushing prices higher, their strength was gradually fading.
The breakdown of this structure signaled a loss of bullish momentum, leading to a shift in trend.
2️⃣ Resistance Level & Sell Zone Identified
The resistance level at $34.00 - $34.50 has acted as a supply zone where sellers stepped in, preventing further upside.
A bearish rejection at this zone confirms that sellers are still dominant.
3️⃣ Retest of the Broken Support (Key Confirmation)
After the breakout from the wedge, the price made a retest of the broken trendline, a classic move before further downside.
Retesting this area confirms that it is now acting as resistance rather than support, further strengthening the bearish case.
4️⃣ Trendline Breakout – Shift in Market Structure
The dashed trendline was previously supportive, but now that the price has broken below it, it has turned into a resistance level.
This shift in market structure is a strong bearish signal.
5️⃣ Key Support Levels & Target Projection
The next major support level is at $32.00, a level where price previously found demand.
The ultimate target price is around $31.18, which aligns with historical support and Fibonacci retracement levels.
📉 Trading Strategy – How to Trade This Setup?
✅ Entry Point (Short/Sell Setup)
A good shorting opportunity arises if the price retests the resistance at $33.50 - $34.00 and shows bearish confirmation (like a rejection candlestick or a bearish engulfing pattern).
📍 Stop Loss (SL) Placement
SL should be above $34.20 to avoid getting stopped out by potential fakeouts.
🎯 Take Profit (TP) Levels
TP1: $32.00 (First support level)
TP2: $31.18 (Final bearish target)
📊 Risk-Reward Ratio
Entry at $33.50 - $34.00 with SL at $34.20 and TP at $31.18 provides an excellent risk-to-reward ratio (~1:4).
📌 Market Sentiment & Conclusion
🔴 Bearish signals are dominant, suggesting further downside potential.
📉 A strong bearish move is expected if the price fails to reclaim $34.00.
🎯 Targeting $31.18 in the upcoming sessions.
📢 Final Advice: Traders should watch for confirmation before entering trades. A successful retest and rejection at $33.50 - $34.00 will be a high-probability short setup. 🚀
🔥 Follow price action and risk management principles for a successful trade! 🔥
For Daily Trade Setups and Forecast: 📈 t.me/xauusdoptimizer
Premium Signals Fr33: 💯 t.me/xauusdoptimizer
🥰🥳🤩
Premium Signals Fr33: 💯 t.me/xauusdoptimizer
🥰🥳🤩
Related publications
Disclaimer
The information and publications are not meant to be, and do not constitute, financial, investment, trading, or other types of advice or recommendations supplied or endorsed by TradingView. Read more in the Terms of Use.