1. Overview of the Chart
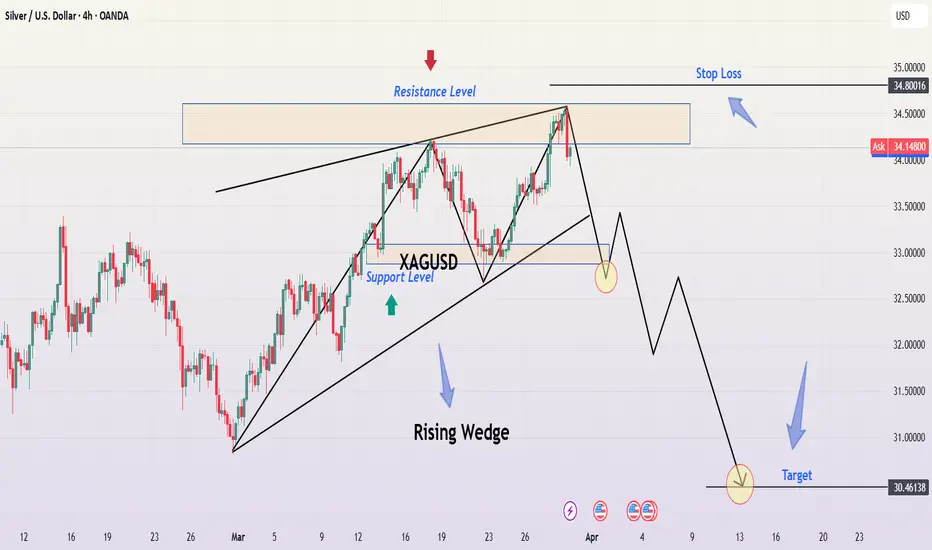
This chart represents Silver (XAG/USD) on the 4-hour timeframe from the OANDA exchange. The price action has formed a Rising Wedge pattern, which is a classic bearish reversal formation. This suggests that a potential breakdown could lead to a significant decline in price.
2. Chart Pattern: Rising Wedge Formation
A Rising Wedge consists of a narrowing price range with higher highs and higher lows, but the slope of the support line (bottom trendline) is steeper than the resistance line (top trendline).
This signals weakening bullish momentum, as buyers are struggling to push the price higher, and sellers are stepping in.
Rising Wedges typically break downward due to the loss of buying strength.
3. Key Technical Levels and Market Structure
A. Resistance Level (Highlighted in Beige Box - $34.50 to $34.80)
This zone has acted as a supply area, where price struggles to break higher.
The price touched this level multiple times, failing to hold above it, which increases the probability of a reversal.
B. Support Level (Highlighted in Blue Box - Around $33.50)
This is a critical short-term support where buyers previously stepped in.
A break below this zone would indicate a confirmation of the wedge breakdown and further downside potential.
C. Stop Loss Level (Marked at $34.80)
Placed above the resistance zone, ensuring protection if price invalidates the pattern and moves higher instead.
This aligns with a logical risk-management strategy to minimize losses if the setup fails.
D. Bearish Breakdown Projection & Target (Marked at $30.46)
The projected target aligns with previous structure support, meaning price may find buyers around this level.
This level is determined by measuring the height of the wedge and projecting it downward from the breakout point.
4. Trading Strategy & Execution Plan
📌 Short (Sell) Trade Setup:
Entry:
Enter a short position once price breaks below the lower trendline of the wedge with strong bearish momentum (e.g., a big red candle closing below support).
A possible retest of the broken support could provide a second entry opportunity.
Stop Loss:
Set at $34.80, above resistance, to ensure the trade is protected against invalidation.
Take Profit (Target):
First target: $32.50 (psychological level and minor support).
Final target: $30.46 (major support and full pattern breakdown projection).
5. Market Psychology & Confirmation Signals
Why This Setup is Bearish?
Price action shows higher highs but with decreasing strength, signaling bull exhaustion.
The Rising Wedge is a well-known bearish structure, and its breakdown typically leads to a strong sell-off.
Volume confirmation: If the breakdown happens with high volume, it strengthens the bearish case.
What to Watch For?
A decisive bearish candle closing below the wedge support confirms the short setup.
If price retests the broken trendline and fails to reclaim it, it provides a second opportunity for entry.
Avoid entering if price consolidates near resistance instead of breaking down.
6. Conclusion: Bearish Bias & Trading Edge
The Rising Wedge formation suggests that Silver is losing bullish momentum and could break down.
Key levels and structure provide a well-defined trade setup, ensuring a good risk-to-reward ratio.
Traders should wait for a confirmed breakdown before entering a short position.
📉 Bearish Outlook – Price likely to drop toward $30.46 target
⚠️ Risk Management is crucial – Stop Loss at $34.80
🎯 Breakdown confirmation needed before entering short positions
Would you like me to refine any part or add more insights? 😊
Related publications
Disclaimer
The information and publications are not meant to be, and do not constitute, financial, investment, trading, or other types of advice or recommendations supplied or endorsed by TradingView. Read more in the Terms of Use.
Related publications
Disclaimer
The information and publications are not meant to be, and do not constitute, financial, investment, trading, or other types of advice or recommendations supplied or endorsed by TradingView. Read more in the Terms of Use.