🔍 Market Context & Technical Overview
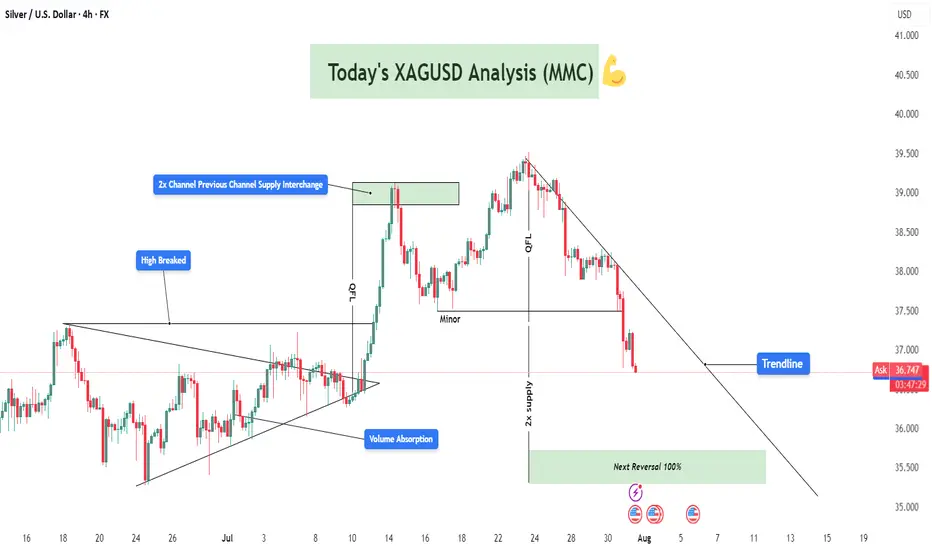
Silver (XAGUSD) has recently gone through a sharp corrective phase after breaking above a key structural high and retesting previous resistance. The current price action reflects a clean MMC-patterned behavior, including volume absorption, QFL trap, and interaction with a descending trendline that has now become critical for further directional bias.
🧠 Key Observations Based on MMC Principles
🔵 1. Volume Absorption at the Triangle Breakout
After a prolonged consolidation phase inside a triangle pattern, volume absorption took place—indicating hidden accumulation.
A breakout above the structure was confirmed with momentum (also breaking a previously established “High Breaked” level).
This breakout led to a vertical move towards the 2x Channel Supply Interchange Zone, where price reversed sharply.
🟥 2. Supply Interchange Zone (2x Confirmed)
Price encountered resistance at the green supply block, which acted as a 2x supply zone—a critical confluence where previous sellers re-engaged.
This area had previously served as the channel boundary, creating a supply interchange effect.
⚠️ 3. QFL Zone Trap (Fake Momentum)
The price printed a QFL structure, where it created a flat base, faked a move up, and quickly reversed.
The QFL base acted as a trap for late buyers, which aligned with the start of a bearish phase that is still ongoing.
📉 4. Downtrend & Trendline Respect
Price has respected a strong descending trendline since the reversal at supply.
Each retest has resulted in a lower high, confirming the bearish structure is intact for now.
Currently, the price is trading below this trendline, reinforcing short-term bearish sentiment.
📦 Key Levels to Watch
Zone/Level Type Role
38.70 – 39.20 2x Supply Zone Strong resistance, reversal origin
37.40 – 37.60 Minor Level Short-term support turned resistance
36.00 – 35.40 Next Reversal Zone ✅ High-probability long area, MMC expects reaction
Trendline Dynamic Structure control, needs break for bullish shift
🔁 Scenarios Based on Structure
📈 Scenario 1: Bullish Reversal from Green Demand Block
Price is approaching the next MMC reversal zone (green box below 36.00).
Proximity to previous institutional accumulation zones
Expected move: bounce toward trendline retest and minor resistance at ~37.50.
📉 Scenario 2: Break Below Green Zone = Panic Sell
If the green zone fails to hold:
A panic drop toward 34.80–35.00 is possible.
However, based on MMC mapping, this is less likely without a major macro catalyst.
💡 Strategic Thoughts (MMC Traders’ Lens)
We’re observing a classic MMC Phase 3 correction following Phase 2 expansion.
The current cycle favors reaccumulation, especially if a wick or engulfing candle forms inside the green zone.
Price action traders should wait for confirmation (e.g., break of trendline, bullish structure on 1H) before entering.
📌 Educational Trade Plan (Not Financial Advice)
Setup Entry Zone Stop Loss Target 1 Target 2
Reversal Long 35.80 – 36.20 35.40 37.50 38.70
Trendline Break Long Above 37.10 36.40 38.00 39.00
Bearish Continuation Below 35.40 36.10 34.80 33.90
🧾 Conclusion & Final Note
Silver is trading at a make-or-break point as it approaches a high-probability reversal zone, identified through MMC methodology. Watch the price action near 36.00 closely—it holds the key to whether we begin a new bullish phase or extend this bearish cycle.
✅ MMC traders will stay reactive, not predictive, and align with structure.
🚨 Patience is key—let the market show its hand before commitment.
Silver (XAGUSD) has recently gone through a sharp corrective phase after breaking above a key structural high and retesting previous resistance. The current price action reflects a clean MMC-patterned behavior, including volume absorption, QFL trap, and interaction with a descending trendline that has now become critical for further directional bias.
🧠 Key Observations Based on MMC Principles
🔵 1. Volume Absorption at the Triangle Breakout
After a prolonged consolidation phase inside a triangle pattern, volume absorption took place—indicating hidden accumulation.
A breakout above the structure was confirmed with momentum (also breaking a previously established “High Breaked” level).
This breakout led to a vertical move towards the 2x Channel Supply Interchange Zone, where price reversed sharply.
🟥 2. Supply Interchange Zone (2x Confirmed)
Price encountered resistance at the green supply block, which acted as a 2x supply zone—a critical confluence where previous sellers re-engaged.
This area had previously served as the channel boundary, creating a supply interchange effect.
⚠️ 3. QFL Zone Trap (Fake Momentum)
The price printed a QFL structure, where it created a flat base, faked a move up, and quickly reversed.
The QFL base acted as a trap for late buyers, which aligned with the start of a bearish phase that is still ongoing.
📉 4. Downtrend & Trendline Respect
Price has respected a strong descending trendline since the reversal at supply.
Each retest has resulted in a lower high, confirming the bearish structure is intact for now.
Currently, the price is trading below this trendline, reinforcing short-term bearish sentiment.
📦 Key Levels to Watch
Zone/Level Type Role
38.70 – 39.20 2x Supply Zone Strong resistance, reversal origin
37.40 – 37.60 Minor Level Short-term support turned resistance
36.00 – 35.40 Next Reversal Zone ✅ High-probability long area, MMC expects reaction
Trendline Dynamic Structure control, needs break for bullish shift
🔁 Scenarios Based on Structure
📈 Scenario 1: Bullish Reversal from Green Demand Block
Price is approaching the next MMC reversal zone (green box below 36.00).
- MMC logic suggests a 100% probability of bullish reaction based on:
- Volume cycle completion
- Downward exhaustion
Proximity to previous institutional accumulation zones
Expected move: bounce toward trendline retest and minor resistance at ~37.50.
📉 Scenario 2: Break Below Green Zone = Panic Sell
If the green zone fails to hold:
A panic drop toward 34.80–35.00 is possible.
However, based on MMC mapping, this is less likely without a major macro catalyst.
💡 Strategic Thoughts (MMC Traders’ Lens)
We’re observing a classic MMC Phase 3 correction following Phase 2 expansion.
The current cycle favors reaccumulation, especially if a wick or engulfing candle forms inside the green zone.
Price action traders should wait for confirmation (e.g., break of trendline, bullish structure on 1H) before entering.
📌 Educational Trade Plan (Not Financial Advice)
Setup Entry Zone Stop Loss Target 1 Target 2
Reversal Long 35.80 – 36.20 35.40 37.50 38.70
Trendline Break Long Above 37.10 36.40 38.00 39.00
Bearish Continuation Below 35.40 36.10 34.80 33.90
🧾 Conclusion & Final Note
Silver is trading at a make-or-break point as it approaches a high-probability reversal zone, identified through MMC methodology. Watch the price action near 36.00 closely—it holds the key to whether we begin a new bullish phase or extend this bearish cycle.
✅ MMC traders will stay reactive, not predictive, and align with structure.
🚨 Patience is key—let the market show its hand before commitment.
For Daily Trade Setups and Forecast: 📈 t.me/xauusdoptimizer
Premium Signals Fr33: 💯 t.me/xauusdoptimizer
🥰🥳🤩
Premium Signals Fr33: 💯 t.me/xauusdoptimizer
🥰🥳🤩
Related publications
Disclaimer
The information and publications are not meant to be, and do not constitute, financial, investment, trading, or other types of advice or recommendations supplied or endorsed by TradingView. Read more in the Terms of Use.