COT: The Managed Money net long remains high at approximately 45,000 contracts. A recent correction of Δ = –4,000 indicates some position unwinding, but the absolute long exposure is still firmly in bullish territory.
ETF Flows: Silver ETFs saw net inflows in June, signaling increased investment interest.
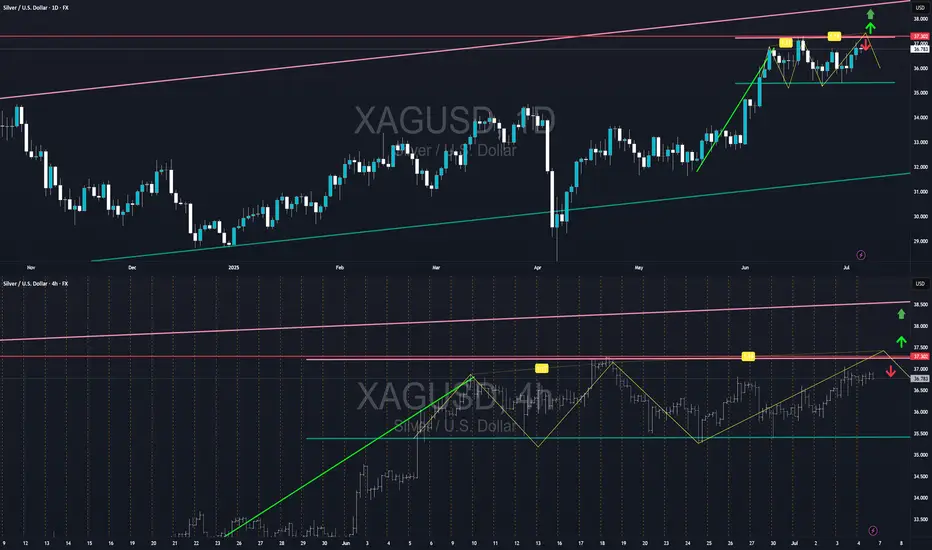
Daily Chart (D1): A bullish flag has formed following the July 1 impulse, with the flag pattern repeating throughout the week.
50-Day EMA: Around $35 – price is holding above this level, confirming the medium-term uptrend.
Silver continues to trade in a medium-term uptrend, supported by declining U.S. real yields, a weaker dollar, and ongoing ETF inflows into precious metals. Despite some reduction in speculative long positions (COT), the overall net long remains substantial.
Technically, price is consolidating above the 50-day EMA on the daily chart and preparing to test resistance at $37.30. A breakout above this level would confirm further upside toward $38.30, whereas a false breakout off the EMA50 (near $37.30) would provide a strong downward impulse and a long entry opportunity with a strict stop-loss ≤ 0.4%.
Trade Ideas:
SHORT at $37.40 on a false breakout above resistance.
LONG near $36.00, based on a double-bottom pattern on the 5-minute chart.
Avoid trading a clean breakout above $37.30—stop-loss would be too large.
Risk Management:
Stop-loss: 0.6%
Take-profit targets: Risk-Reward ratios of 1:3 and 1:5.
ETF Flows: Silver ETFs saw net inflows in June, signaling increased investment interest.
Daily Chart (D1): A bullish flag has formed following the July 1 impulse, with the flag pattern repeating throughout the week.
50-Day EMA: Around $35 – price is holding above this level, confirming the medium-term uptrend.
Silver continues to trade in a medium-term uptrend, supported by declining U.S. real yields, a weaker dollar, and ongoing ETF inflows into precious metals. Despite some reduction in speculative long positions (COT), the overall net long remains substantial.
Technically, price is consolidating above the 50-day EMA on the daily chart and preparing to test resistance at $37.30. A breakout above this level would confirm further upside toward $38.30, whereas a false breakout off the EMA50 (near $37.30) would provide a strong downward impulse and a long entry opportunity with a strict stop-loss ≤ 0.4%.
Trade Ideas:
SHORT at $37.40 on a false breakout above resistance.
LONG near $36.00, based on a double-bottom pattern on the 5-minute chart.
Avoid trading a clean breakout above $37.30—stop-loss would be too large.
Risk Management:
Stop-loss: 0.6%
Take-profit targets: Risk-Reward ratios of 1:3 and 1:5.
Хочешь хороших денег – умей выжидать
Disclaimer
The information and publications are not meant to be, and do not constitute, financial, investment, trading, or other types of advice or recommendations supplied or endorsed by TradingView. Read more in the Terms of Use.
Хочешь хороших денег – умей выжидать
Disclaimer
The information and publications are not meant to be, and do not constitute, financial, investment, trading, or other types of advice or recommendations supplied or endorsed by TradingView. Read more in the Terms of Use.