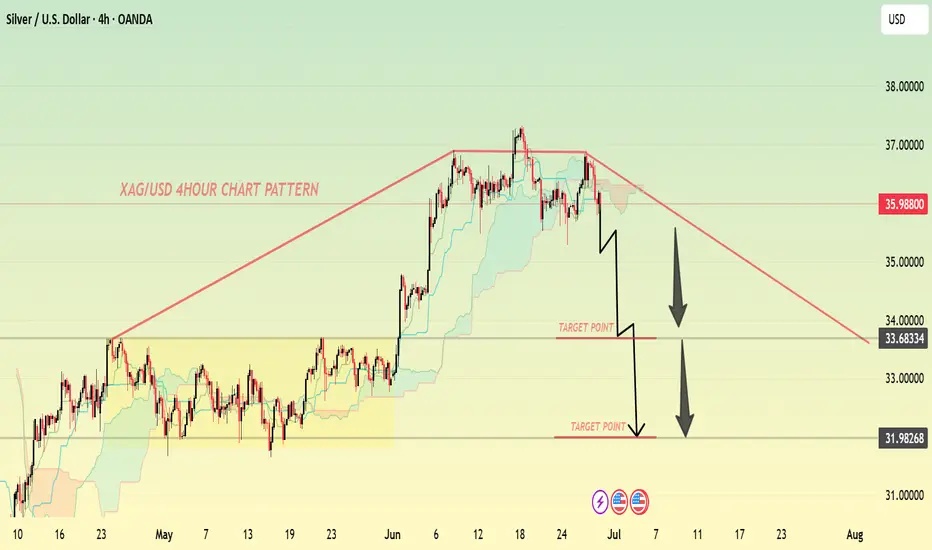
"XAGUSD 4H Chart – Bearish Breakdown From Descending Triangle Pattern"
📥 Entry Zone:
Sell zone: 36.20 – 35.80
🎯 Target Points:
First Target: 33.68
Second Target: 31.98
📈 Trade Setup:
Position: Sell
Entry: Near 36.00
SL (Stop Loss): Above 36.80 (Recent high)
TP1: 33.68
TP2: 31.98
💰 Risk-Reward Ratio:
Approx. 1:2 to 1:3 depending on stop-loss tightness and target selected.
📝 Summary:
XAGUSD is showing a potential bearish breakdown from a descending triangle on the 4-hour chart. The market structure indicates weakening bullish strength, with potential for price to drop to support levels at 33.68 and 31.98. Ideal for short setups after confirmation below the trendline and cloud zone
Trade active
trade activet.me/Smart_Money_Flow_SMF
Forex, Gold & crypto Signals with detailed Analysis .
t.me/Smart_Money_Flow_SMF
Gold Signals With proper TP & SL
Forex, Gold & crypto Signals with detailed Analysis .
t.me/Smart_Money_Flow_SMF
Gold Signals With proper TP & SL
Disclaimer
The information and publications are not meant to be, and do not constitute, financial, investment, trading, or other types of advice or recommendations supplied or endorsed by TradingView. Read more in the Terms of Use.
t.me/Smart_Money_Flow_SMF
Forex, Gold & crypto Signals with detailed Analysis .
t.me/Smart_Money_Flow_SMF
Gold Signals With proper TP & SL
Forex, Gold & crypto Signals with detailed Analysis .
t.me/Smart_Money_Flow_SMF
Gold Signals With proper TP & SL
Disclaimer
The information and publications are not meant to be, and do not constitute, financial, investment, trading, or other types of advice or recommendations supplied or endorsed by TradingView. Read more in the Terms of Use.