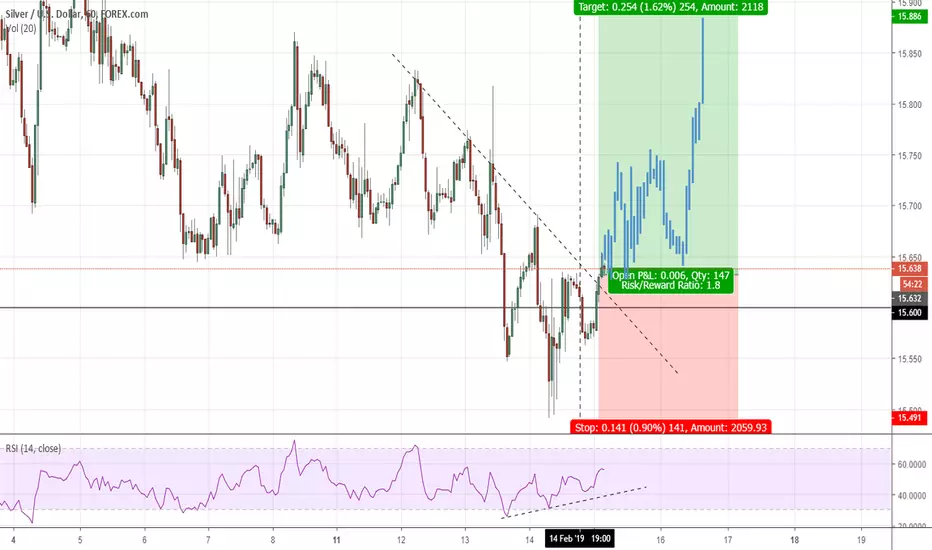
Analysis
-XAGUSD looking bullish after showing signs of reversal wherein sellers pushed price down into support and buyers stepped in and pushed price up before the daily candle close.
-The price action resulted in a daily candle pinbar setup AT SUPPORT which is a bullish sign.
-On the 1H time frame, price just broke a downtrend to the upside.
-There is also bullish RSI divergence on the 1H time frame which further eludes to price possibly reversing to the upside.
Entry, Stops and Targets
-Long Entry: 15.632
-Stop Loss: 15.491 (Set stop below the low of the daily reversal candle)
-Take Profit: 15.886 (Set target at a minimum of 1.8 times your stop depending on entry)
*Always practice good risk management and know your limit!*
Disclaimer
The information and publications are not meant to be, and do not constitute, financial, investment, trading, or other types of advice or recommendations supplied or endorsed by TradingView. Read more in the Terms of Use.
Disclaimer
The information and publications are not meant to be, and do not constitute, financial, investment, trading, or other types of advice or recommendations supplied or endorsed by TradingView. Read more in the Terms of Use.