XAIUSDT just saw an extraordinary surge in activity—trading volume jumped over 256.9% in the last 24 hours. That level of interest tells us smart money was active, but price action hasn’t confirmed a sustained move higher.
🔴 Key Resistance Zones
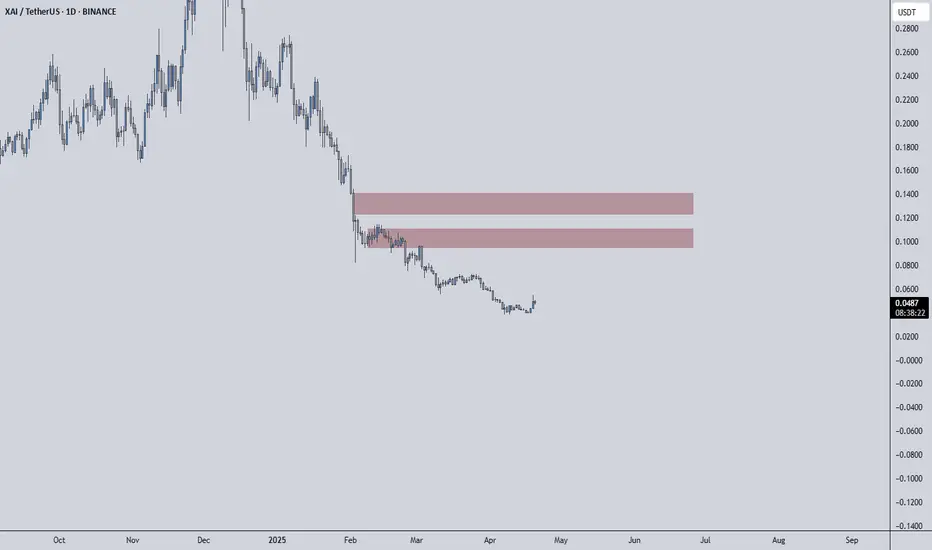
The red boxes on the chart mark areas where XAI has struggled before. Each time price has approached these zones, sellers stepped in decisively.
Right now, price is once again testing those levels and showing signs of hesitation.
📉 What I’m Watching for Shorts
Lower Time Frame Breakdowns: I’ll look for clear downside structure on a 5‑ or 15‑minute chart inside the red box.
CDV and Volume Confirmation: If selling volume spikes and CDV shifts negative at resistance, it’s a strong signal to short.
🟢 What Could Flip My Bias
I won’t cling to a bearish view if the market shows real strength. If XAI breaks above the red boxes with conviction—backed by rising volume—and then retests those zones as support, I’m ready to switch gears and look for a long entry.
🤝 Why You Can Trust This Setup
I focus on coins leading in volume for the day—these are the assets where big moves originate. Every level I share is battle‑tested in live markets, and you can see my success rate in my profile. Most traders react emotionally. We wait for the market to confirm. That’s how you stay ahead.
Remember: I will not insist on my short idea. If the levels suddenly break upwards and do not give a downward break in the low time frame, I will not evaluate it. If they break upwards with volume and give a retest, I will look long.
Stay patient, trade with confirmation, and let the market speak.
📌I keep my charts clean and simple because I believe clarity leads to better decisions.
📌My approach is built on years of experience and a solid track record. I don’t claim to know it all but I’m confident in my ability to spot high-probability setups.
📌If you would like to learn how to use the heatmap, cumulative volume delta and volume footprint techniques that I use below to determine very accurate demand regions, you can send me a private message. I help anyone who wants it completely free of charge.
🔑I have a long list of my proven technique below:
I stopped adding to the list because it's kinda tiring to add 5-10 charts in every move but you can check my profile and see that it goes on..
🔴 Key Resistance Zones
The red boxes on the chart mark areas where XAI has struggled before. Each time price has approached these zones, sellers stepped in decisively.
Right now, price is once again testing those levels and showing signs of hesitation.
📉 What I’m Watching for Shorts
Lower Time Frame Breakdowns: I’ll look for clear downside structure on a 5‑ or 15‑minute chart inside the red box.
CDV and Volume Confirmation: If selling volume spikes and CDV shifts negative at resistance, it’s a strong signal to short.
🟢 What Could Flip My Bias
I won’t cling to a bearish view if the market shows real strength. If XAI breaks above the red boxes with conviction—backed by rising volume—and then retests those zones as support, I’m ready to switch gears and look for a long entry.
🤝 Why You Can Trust This Setup
I focus on coins leading in volume for the day—these are the assets where big moves originate. Every level I share is battle‑tested in live markets, and you can see my success rate in my profile. Most traders react emotionally. We wait for the market to confirm. That’s how you stay ahead.
Remember: I will not insist on my short idea. If the levels suddenly break upwards and do not give a downward break in the low time frame, I will not evaluate it. If they break upwards with volume and give a retest, I will look long.
Stay patient, trade with confirmation, and let the market speak.
📌I keep my charts clean and simple because I believe clarity leads to better decisions.
📌My approach is built on years of experience and a solid track record. I don’t claim to know it all but I’m confident in my ability to spot high-probability setups.
📌If you would like to learn how to use the heatmap, cumulative volume delta and volume footprint techniques that I use below to determine very accurate demand regions, you can send me a private message. I help anyone who wants it completely free of charge.
🔑I have a long list of my proven technique below:
- 🎯 ZENUSDT.P: Patience & Profitability | %230 Reaction from the Sniper Entry
- 🐶 DOGEUSDT.P: Next Move
- 🎨 RENDERUSDT.P: Opportunity of the Month
- 💎 ETHUSDT.P: Where to Retrace
- 🟢 BNBUSDT.P: Potential Surge
- 📊 BTC Dominance: Reaction Zone
- 🌊 WAVESUSDT.P: Demand Zone Potential
- 🟣 UNIUSDT.P: Long-Term Trade
- 🔵 XRPUSDT.P: Entry Zones
- 🔗 LINKUSDT.P: Follow The River
- 📈 BTCUSDT.P: Two Key Demand Zones
- 🟩 POLUSDT: Bullish Momentum
- 🌟 PENDLEUSDT.P: Where Opportunity Meets Precision
- 🔥 BTCUSDT.P: Liquidation of Highly Leveraged Longs
- 🌊 SOLUSDT.P: SOL's Dip - Your Opportunity
- 🐸 1000PEPEUSDT.P: Prime Bounce Zone Unlocked
- 🚀 ETHUSDT.P: Set to Explode - Don't Miss This Game Changer
- 🤖 IQUSDT: Smart Plan
- ⚡️ PONDUSDT: A Trade Not Taken Is Better Than a Losing One
- 💼 STMXUSDT: 2 Buying Areas
- 🐢 TURBOUSDT: Buy Zones and Buyer Presence
- 🌍 ICPUSDT.P: Massive Upside Potential | Check the Trade Update For Seeing Results
- 🟠 IDEXUSDT: Spot Buy Area | %26 Profit if You Trade with MSB
- 📌 USUALUSDT: Buyers Are Active + %70 Profit in Total
- 🌟 FORTHUSDT: Sniper Entry +%26 Reaction
- 🐳 QKCUSDT: Sniper Entry +%57 Reaction
- 📊 BTC.D: Retest of Key Area Highly Likely
- 📊 XNOUSDT %80 Reaction with a Simple Blue Box!
- 📊 BELUSDT Amazing %120 Reaction!
I stopped adding to the list because it's kinda tiring to add 5-10 charts in every move but you can check my profile and see that it goes on..
Professional Day Trader
Microstructure Practicioner
t.me/umuttrades
kick.com/umuttrades live everyday.
Microstructure Practicioner
t.me/umuttrades
kick.com/umuttrades live everyday.
Related publications
Disclaimer
The information and publications are not meant to be, and do not constitute, financial, investment, trading, or other types of advice or recommendations supplied or endorsed by TradingView. Read more in the Terms of Use.