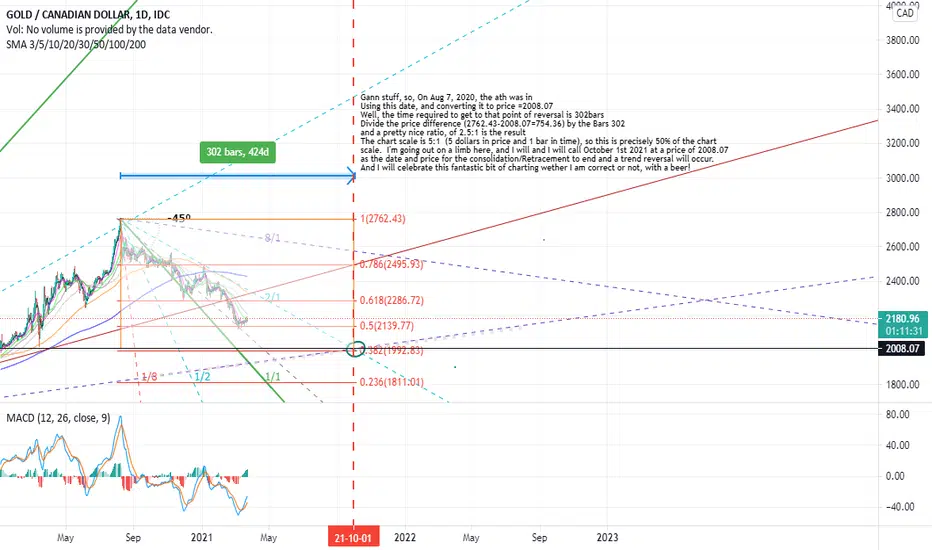
Gann stuff, so, On Aug 7, 2020, the ath was in. Using this date, and converting it to price =2008.07. Well, the time required to get to that point of reversal is 302bars. Divide the price difference (2762.43-2008.07=754.36) by the Bars 302 and a pretty nice ratio, of 2.5:1 is the result. The chart scale is 5:1 (5 dollars in price and 1 bar in time), so this is precisely 50% (or is it twice??) of the chart scale. I'm going out on a limb here, and I will and I will call October 1st 2021 at a price of $2008.07 as the date and price for the consolidation/Retracement to end and a trend reversal will occur.
And I will celebrate this fantastic bit of charting wether I am correct or not, with a beer! Ha! GLTA!!
I don't suggest using any of this as any sort of advice whatsoever! Please do your due diligence and if ya like what you see, then go ahead and give it a shot!!
And I will celebrate this fantastic bit of charting wether I am correct or not, with a beer! Ha! GLTA!!
I don't suggest using any of this as any sort of advice whatsoever! Please do your due diligence and if ya like what you see, then go ahead and give it a shot!!
Disclaimer
The information and publications are not meant to be, and do not constitute, financial, investment, trading, or other types of advice or recommendations supplied or endorsed by TradingView. Read more in the Terms of Use.
Disclaimer
The information and publications are not meant to be, and do not constitute, financial, investment, trading, or other types of advice or recommendations supplied or endorsed by TradingView. Read more in the Terms of Use.