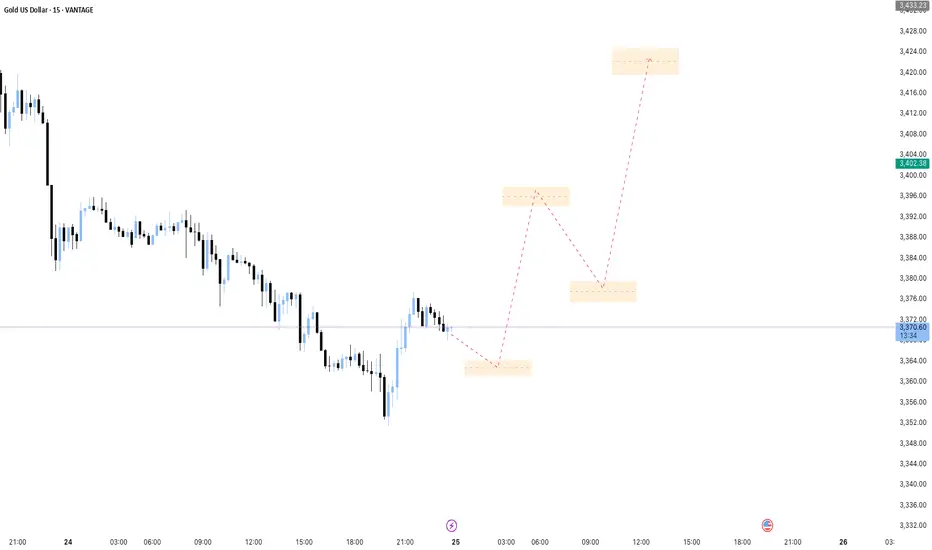
The Gold USD market on the 15-minute timeframe shows a notable downtrend followed by a retracement phase. The price is currently moving in a potential reversal structure with key areas marked as possible retracement or continuation points.
The chart highlights multiple potential support and resistance zones, indicated with small orange boxes, which mark anticipated areas for price reactions during the expected short-term moves.
The trading plan anticipates price to move upward towards these intermediate zones sequentially, with each zone acting as a minor resistance before price attempts to continue its bullish retracement. After reaching the higher target zone near 3424, a reversal or new wave is expected to unfold, potentially resuming the downtrend.
This plan emphasizes careful monitoring of price action at these key zones to confirm reversal or continuation signals. Traders should look for confirmation signals like pin bars, candle patterns, or volume clues at each zone before entering the trade.
Risk management involves setting appropriate stops beyond these resistance zones to protect against false breakouts or sudden trend changes.
This approach uses a combination of technical levels, price action confirmation, and careful zone analysis to guide trading decisions in a fast-moving market.
Disclaimer
The information and publications are not meant to be, and do not constitute, financial, investment, trading, or other types of advice or recommendations supplied or endorsed by TradingView. Read more in the Terms of Use.
Disclaimer
The information and publications are not meant to be, and do not constitute, financial, investment, trading, or other types of advice or recommendations supplied or endorsed by TradingView. Read more in the Terms of Use.
