📉 Gold Spot (XAU/USD) 4H Analysis – Bearish Momentum Continues 🔻🪙
🔍 Overview:
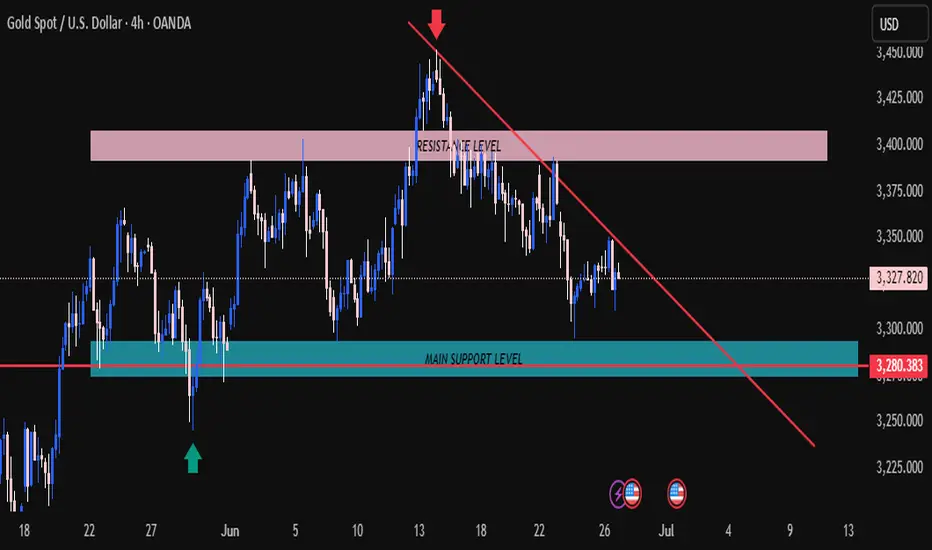
Gold is currently trading within a descending trendline structure, respecting a clear downtrend on the 4H chart. After failing to break the key resistance zone around $3,400 - $3,420, price has continued to make lower highs and lower lows.
📌 Key Technical Zones:
🔴 Resistance Zone:
$3,400 – $3,420
Strong selling pressure observed. Price was rejected here after a sharp rally.
📐 Descending Trendline:
Price continues to get rejected from this dynamic resistance.
Bearish pressure remains intact as long as this line holds.
🟦 Main Support Level:
$3,280 – $3,300
Price has tested this zone multiple times, showing strong buyer interest.
A break below this level could trigger further downside.
📊 Technical Outlook:
🟥 Bearish Bias as long as price remains under the trendline.
✅ Buyers may re-enter at the support zone around $3,280.
⚠️ If support breaks, the next downside target could be $3,240 – $3,220.
📈 Trading Plan Suggestion:
🔎 Watch for rejection at trendline or resistance zone for potential short setups.
🔔 Monitor support zone reaction for potential bounce plays or breakout confirmation.
📆 Date of Analysis: June 26, 2025
📍 Timeframe: 4-Hour (H4)
💬 “Trend is your friend until it bends.”
Trade wisely! 💼📊💡
🔍 Overview:
Gold is currently trading within a descending trendline structure, respecting a clear downtrend on the 4H chart. After failing to break the key resistance zone around $3,400 - $3,420, price has continued to make lower highs and lower lows.
📌 Key Technical Zones:
🔴 Resistance Zone:
$3,400 – $3,420
Strong selling pressure observed. Price was rejected here after a sharp rally.
📐 Descending Trendline:
Price continues to get rejected from this dynamic resistance.
Bearish pressure remains intact as long as this line holds.
🟦 Main Support Level:
$3,280 – $3,300
Price has tested this zone multiple times, showing strong buyer interest.
A break below this level could trigger further downside.
📊 Technical Outlook:
🟥 Bearish Bias as long as price remains under the trendline.
✅ Buyers may re-enter at the support zone around $3,280.
⚠️ If support breaks, the next downside target could be $3,240 – $3,220.
📈 Trading Plan Suggestion:
🔎 Watch for rejection at trendline or resistance zone for potential short setups.
🔔 Monitor support zone reaction for potential bounce plays or breakout confirmation.
📆 Date of Analysis: June 26, 2025
📍 Timeframe: 4-Hour (H4)
💬 “Trend is your friend until it bends.”
Trade wisely! 💼📊💡
Disclaimer
The information and publications are not meant to be, and do not constitute, financial, investment, trading, or other types of advice or recommendations supplied or endorsed by TradingView. Read more in the Terms of Use.
Disclaimer
The information and publications are not meant to be, and do not constitute, financial, investment, trading, or other types of advice or recommendations supplied or endorsed by TradingView. Read more in the Terms of Use.