🌀 Wave Structure
Looking at the H1 chart during the Asian session today:
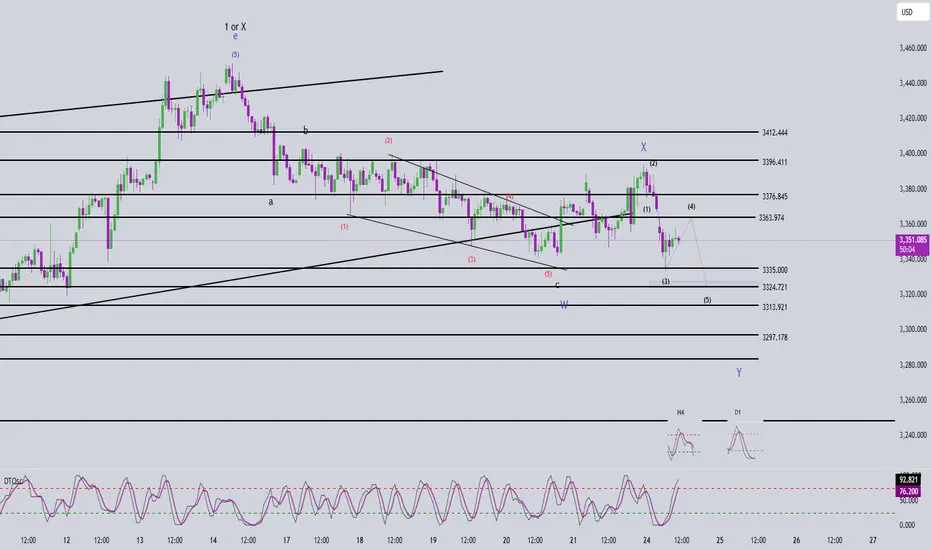
+ Price broke below the previous low at 3341, invalidating the idea that Friday’s rally marked the beginning of a new uptrend.
+ Instead, the rally appears to be forming a wave X in a larger WXY corrective structure.
+ Given the current complex corrective pattern, it’s challenging to precisely define the exact wave shape and targets.
🔻 Wave Y Structure:
+ The price action suggests the formation of a 5-wave decline, with the market currently in wave 4.
+ Wave 4 target zone: 3357 – 3363 → Sell zone.
+ After completing wave 4, we expect a continuation of the downtrend via wave 5, with a target around 3327 – 3324 → Buy zone.
+ Once wave 5 completes, we anticipate at least a corrective upward retracement, with targets at 3363 – 3376 (these are the TP levels for the buy trade).
⚡️ Momentum Analysis
+ D1 timeframe: Momentum is turning bullish, suggesting a potential rally lasting around 5–8 D1 candles after wave 5 finishes.
+ H4 timeframe: Momentum is declining and may enter oversold territory within 1–2 candles, supporting the completion of wave 5.
+ H1 timeframe: Momentum is rising and approaching overbought levels, indicating a likely end of wave 4 within 1–2 H1 candles.
📌 Trade Plan
🔹 SELL ZONE: 3363 – 3365
+ SL: 3373
+ TP1: 3342
+ TP2: 3330
🔹 BUY ZONE: 3327 – 3324
+ SL: 3317
+ TP1: 3342
+ TP2: 3363
+ TP3: 3376
+ Important Note:❗️
- If price reaches these zones with a Mazuboru candle (long-bodied candle with no wick) and fast volatility, do not enter immediately.
- Wait for the candle to close. If the zone breaks, keep an eye on the next support area around 3313 for potential reactions.
Trade active
Elliott Wave Update – XAUUSD H1 Chart🌀 Wave Structure
On the H1 timeframe, we can see a 5-wave triangle formation has completed, followed by a strong breakout above the upper boundary of the triangle.
This raises the possibility that wave Y of the corrective phase has been completed, and a new upward trend may be forming.
⚡ Momentum Confirmation
We will rely on momentum signals for confirmation:
If momentum drops into oversold territory and then reverses to the upside,
And price does not break below 3297,
👉 Then it is highly likely that the corrective phase has ended, and this week’s trend will be bullish.
📌 Trade Plan
🔹 BUY ZONE: 3304 – 3301
🔹 SL: 3293
🔹 TP1: 3324
🔹 TP2: 3363
👉 Join the channel to receive more scalping signals!
Channel Telegram: t.me/+XkFQ95yHVOEwNDc1
Channel Telegram: t.me/+XkFQ95yHVOEwNDc1
Related publications
Disclaimer
The information and publications are not meant to be, and do not constitute, financial, investment, trading, or other types of advice or recommendations supplied or endorsed by TradingView. Read more in the Terms of Use.