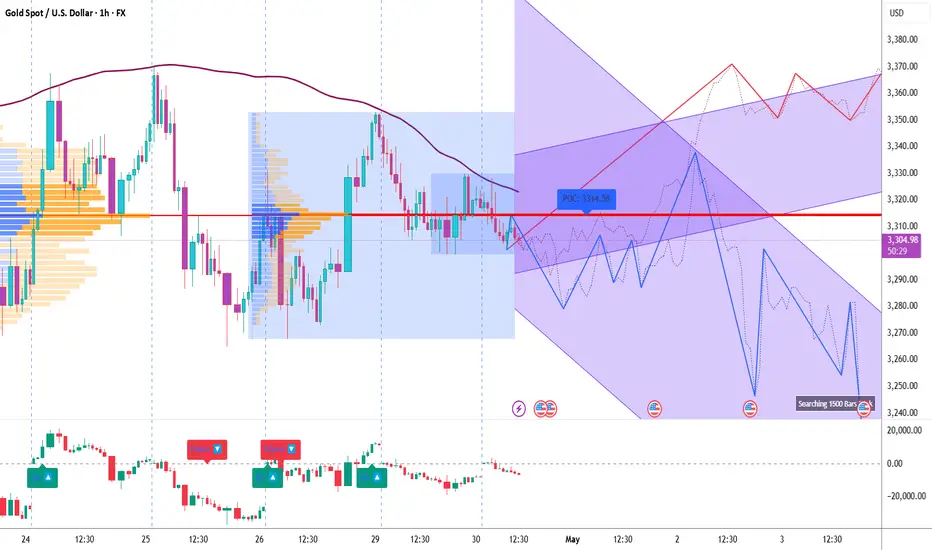
Here’s the detailed breakdown of the Gold Spot / USD (XAU/USD) 1H Chart based on Volume Profile, Gann analysis, and custom indicators (CVD + ADX):
1. Key Observations (Volume, Gann & CVD + ADX Focused)
a) Volume Profile Insights:
• Value Area High (VAH): 3325.00
• Value Area Low (VAL): 3302.00
• Point of Control (POC): 3314.58
• High-volume nodes: Notable clustering around 3310–3325 zone, suggesting accumulation.
• Low-volume gaps: 3340–3360 zone shows thin profile—potential breakout area if breached.
b) Liquidity Zones:
• Liquidity Clusters:
o Upside: Prior highs near 3360 and 3380 may have stop orders.
o Downside: 3280–3290 (recent swing lows) likely holding short-term stops.
• Absorption Zones: Strong absorption observed just below POC (3305–3310), indicating defense by buyers.
c) Volume-Based Swing Highs/Lows:
• Swing High (Volume Spike): 3360 on April 26 – high rejection with strong sell volume.
• Swing Low (Volume Spike): 3285 on April 25 – major buying tail, reversal support zone.
d) CVD + ADX Indicator Analysis:
• Trend Direction: Currently range-bound; no clean directional move post 28th April.
• ADX Strength:
o ADX < 20: Weak trend environment
o DI+ ≈ DI-: Confirms lack of clear directional bias
• CVD Confirmation:
o Neutral to slightly rising CVD, indicating moderate demand but not dominant
o No divergence between price and CVD—suggests indecision
________________________________________
2. Support & Resistance Levels
a) Volume-Based Levels:
• Support:
o VAL: 3302.00
o POC: 3314.58
o Swing low: 3285.00 (with high delta absorption)
• Resistance:
o VAH: 3325.00
o Swing highs: 3360.00 and 3380.00
b) Gann-Based Levels:
• Gann Swing High: 3360 (April 26)
• Gann Swing Low: 3285 (April 25)
• Key Retracements:
o 1/2: 3322.5
o 1/3: 3310
o 2/3: 3340
________________________________________
3. Chart Patterns & Market Structure
a) Trend: Range-bound (confirmed by flat ADX and neutral CVD)
b) Notable Patterns:
• Descending triangle forming between 3325 (horizontal resistance) and lower highs
• Potential breakout scenario if price clears 3325 with volume
• Retests of POC at 3314 providing short-term scalping setups
________________________________________
4. Trade Setup & Risk Management
a) Bullish Entry (If CVD + ADX confirm uptrend):
• Entry Zone: 3310–3315
• Targets:
o T1: 3340
o T2: 3360
• Stop-Loss (SL): 3295 (below VAL)
• RR: Minimum 1:2
b) Bearish Entry (If CVD + ADX confirm downtrend):
• Entry Zone: 3325–3330
• Target:
o T1: 3285
• Stop-Loss (SL): 3345 (above recent swing high)
• RR: Minimum 1:2
c) Position Sizing: Risk only 1-2% of capital per trade
Bharat Pandya @ProspireWealth
+91 9624044866
pandyabn76@gmail.com
+91 9624044866
pandyabn76@gmail.com
Disclaimer
The information and publications are not meant to be, and do not constitute, financial, investment, trading, or other types of advice or recommendations supplied or endorsed by TradingView. Read more in the Terms of Use.