In early Asian trading on Tuesday, gold fluctuated and fell, currently trading around 2325. Gold prices rebounded 0.56% on Monday, helped by the dollar's retreat as Fed officials said the risk of rising unemployment was increasing. Investors began to wait for U.S. inflation data to be released later this week, which may affect the Fed's monetary policy path.
The dollar fell 0.3%, risk appetite deteriorated, and investors seeking safety bought gold, making gold attractive to holders of other currencies. It should be reminded that the U.S. dollar index showed a similar "engulfing" bearish candlestick combination at the daily level, and it is necessary to be vigilant about the further downside risk of the U.S. dollar index in the short term, which may provide further opportunities for gold prices to rebound.
The focus this week will be Friday's U.S. personal consumption expenditures (PCE) price index data, which is the inflation indicator favored by the Federal Reserve. Pay attention to the performance of the U.S. Conference Board Consumer Confidence Index in June this trading day. Also of concern are the speeches that several Fed officials will make this week, including Fed Governors Cook and Bowman.
[Technical side]
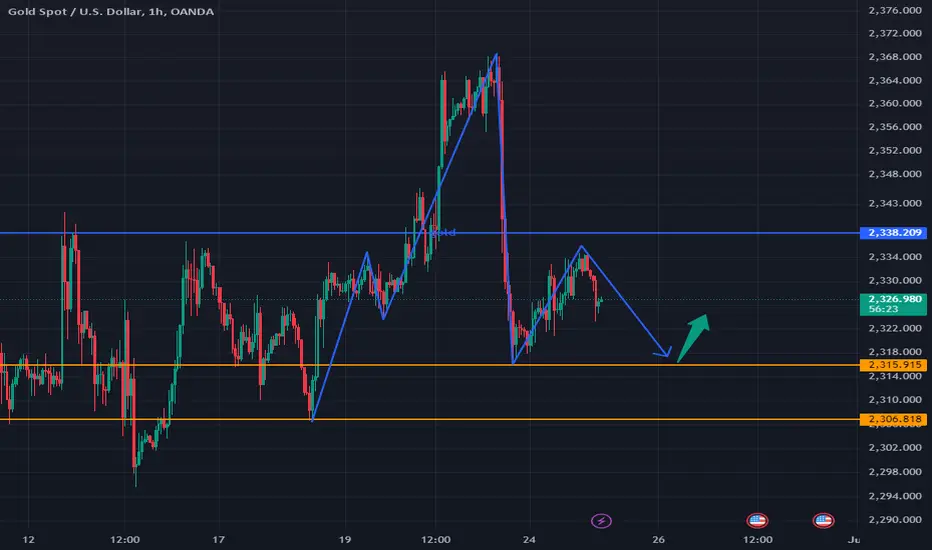
Gold rebounded and adjusted in the late trading, the weekly MA10 was moving down, and the Bollinger middle track was moving up. The entire weekly trend trajectory was in line with the prediction last week, that is, the overall weekly trend was expected to be a contraction trend between the MA10 and the Bollinger middle track. The technical side entered into a shock consolidation again, and the daily line could not rule out the possibility of continuing to alternate between yin and yang. The high-altitude and low-multiple ideas are deployed during the day! First look at the 2326/2320 support and 2338/2343 resistance during the day.
Asian trading strategy:
Short-term gold 2315-2318 long, stop loss 2306, target 2335-2345;
Short-term gold 2335-2338 short, stop loss 2344, target 2320-2310;
Note: The above strategy was updated on June 25. This strategy is an Asian strategy, please pay attention to the effective time of the strategy

The dollar fell 0.3%, risk appetite deteriorated, and investors seeking safety bought gold, making gold attractive to holders of other currencies. It should be reminded that the U.S. dollar index showed a similar "engulfing" bearish candlestick combination at the daily level, and it is necessary to be vigilant about the further downside risk of the U.S. dollar index in the short term, which may provide further opportunities for gold prices to rebound.
The focus this week will be Friday's U.S. personal consumption expenditures (PCE) price index data, which is the inflation indicator favored by the Federal Reserve. Pay attention to the performance of the U.S. Conference Board Consumer Confidence Index in June this trading day. Also of concern are the speeches that several Fed officials will make this week, including Fed Governors Cook and Bowman.
[Technical side]
Gold rebounded and adjusted in the late trading, the weekly MA10 was moving down, and the Bollinger middle track was moving up. The entire weekly trend trajectory was in line with the prediction last week, that is, the overall weekly trend was expected to be a contraction trend between the MA10 and the Bollinger middle track. The technical side entered into a shock consolidation again, and the daily line could not rule out the possibility of continuing to alternate between yin and yang. The high-altitude and low-multiple ideas are deployed during the day! First look at the 2326/2320 support and 2338/2343 resistance during the day.
Asian trading strategy:
Short-term gold 2315-2318 long, stop loss 2306, target 2335-2345;
Short-term gold 2335-2338 short, stop loss 2344, target 2320-2310;
Note: The above strategy was updated on June 25. This strategy is an Asian strategy, please pay attention to the effective time of the strategy
Trade active
Trade active
Trade active
I hope someone profited from my analysis today, 2335 has dropped 10 dollars nowTrade active
From the perspective of technical analysis, gold prices are currently being fiercely contested by both long and short sides. Here are some key technical analysis points:1.4-hour chart: Gold prices are trading below the 50-period exponential moving average (EMA), which supports the expectation of a bearish trend. If gold prices remain below 2340.10, the bearish expectation will continue to be valid.
2. Daily chart: The relative strength index (RSI) remains below 50, indicating that sellers are still dominant. In addition, the bearish crossover of the 21-day moving average (SMA) and the 50-day SMA exerts additional bearish pressure on gold prices.
3. Support and resistance: Gold prices are expected to trade between the support level of 2305.00 and the resistance level of 2340.00 today. If gold prices fall below the triangle support line of 2320, it may trigger further selling.
Trade active
Trade active
Guys, let's keep holding sell orders, our first target is around 2310/second target is 2300Trade active
Today's transaction has been manually TP Trade active
Today's downward trend continues from yesterday, and our short position has been closed. Related publications
Disclaimer
The information and publications are not meant to be, and do not constitute, financial, investment, trading, or other types of advice or recommendations supplied or endorsed by TradingView. Read more in the Terms of Use.
Related publications
Disclaimer
The information and publications are not meant to be, and do not constitute, financial, investment, trading, or other types of advice or recommendations supplied or endorsed by TradingView. Read more in the Terms of Use.