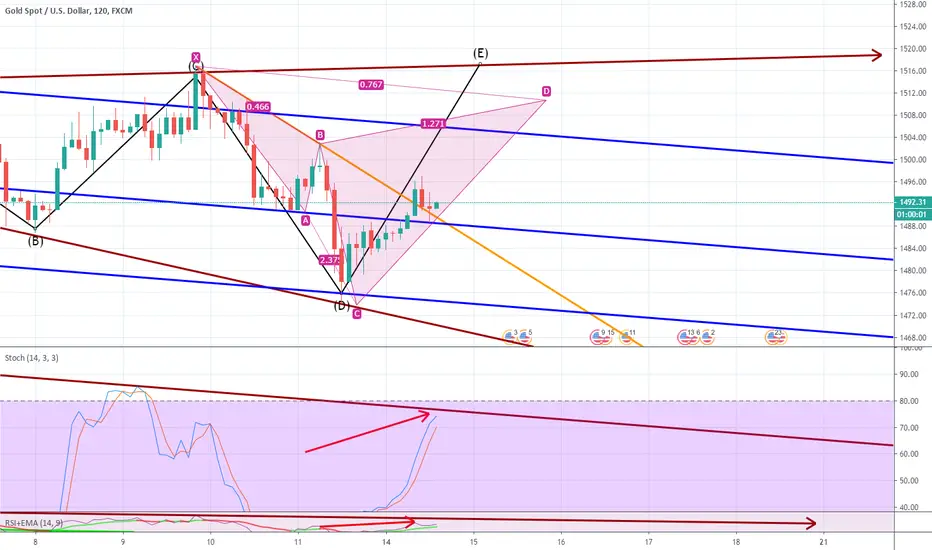
bullish scenario = bounce from orange trend line
bearish scenario = break down orange trend line + blue trend line
NOTE:
1. i still believe daily candle close 76-86 (october 14)
2. this bullish scenario could happen at 15 oc to 16 oct
bearish scenario = break down orange trend line + blue trend line
NOTE:
1. i still believe daily candle close 76-86 (october 14)
2. this bullish scenario could happen at 15 oc to 16 oct
Note
i would projected wave 2 down, until daily candle close, then wave 3 at 15 october then wave 4 at 16 october
Note
stochastic divergence now.... monitoring this 2h candle...
Note
yup stochastic hit bearish divergence, now entering bearish trend again...Disclaimer
The information and publications are not meant to be, and do not constitute, financial, investment, trading, or other types of advice or recommendations supplied or endorsed by TradingView. Read more in the Terms of Use.
Disclaimer
The information and publications are not meant to be, and do not constitute, financial, investment, trading, or other types of advice or recommendations supplied or endorsed by TradingView. Read more in the Terms of Use.