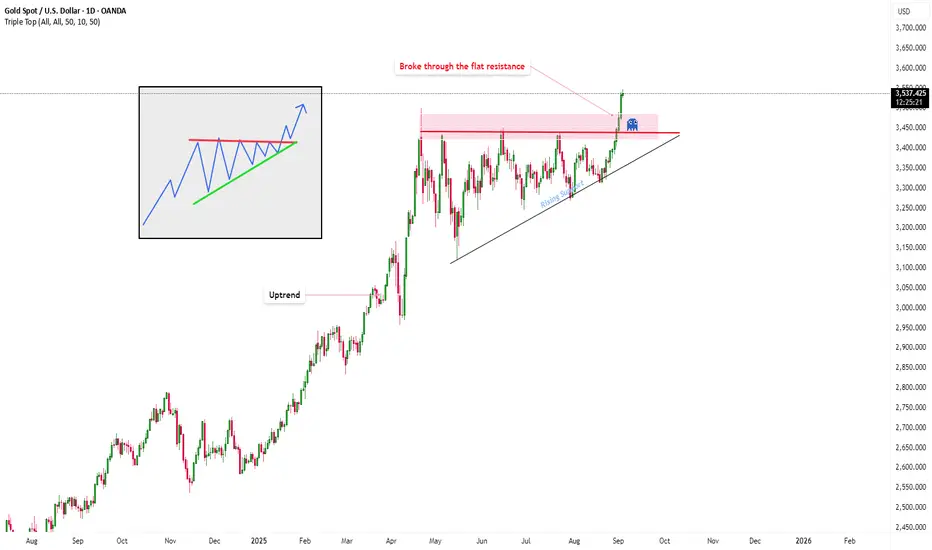
If we zoom out and take a look at how the price moved on GOLD, we can see the following:
The price repeatedly tested the area of resistance while setting consecutively higher lows.
The highs around the resistance price formed a horizontal line. Then, it recently broke it with strength.
This forms a confirmed ascending triangle.
Ascending triangles form due to accumulation in an uptrend. There isn’t enough bullish momentum to break through the area of resistance, but bulls are buying up on each dip.
But this important resistance just got broken.
This recent bullish breakout above the resistance area, meant the completion of a bigger ascending triangle pattern.
Now this is good news. Why?
Because if we measure the distance between the resistance area and the lowest low at the start of the pattern and add that to the resistance zone, to calculate the profit target, it means that we can see quite a move to the upside.
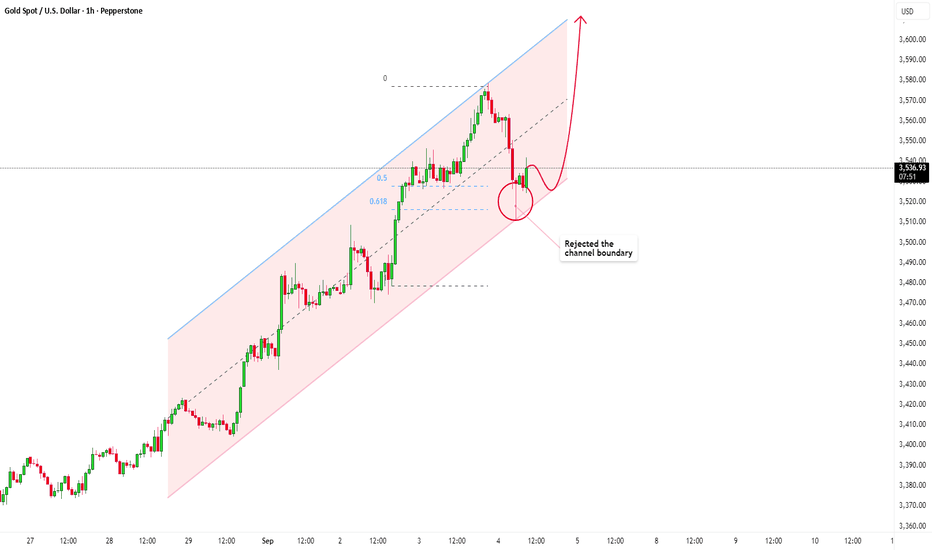
So we could look for a break-and-retest right here.
BUT, when a breakout like this one fails, either initiating a reversal or more sideways move, then we can see a correction and caution is advised.
The price repeatedly tested the area of resistance while setting consecutively higher lows.
The highs around the resistance price formed a horizontal line. Then, it recently broke it with strength.
This forms a confirmed ascending triangle.
Ascending triangles form due to accumulation in an uptrend. There isn’t enough bullish momentum to break through the area of resistance, but bulls are buying up on each dip.
But this important resistance just got broken.
This recent bullish breakout above the resistance area, meant the completion of a bigger ascending triangle pattern.
Now this is good news. Why?
Because if we measure the distance between the resistance area and the lowest low at the start of the pattern and add that to the resistance zone, to calculate the profit target, it means that we can see quite a move to the upside.
So we could look for a break-and-retest right here.
BUT, when a breakout like this one fails, either initiating a reversal or more sideways move, then we can see a correction and caution is advised.
Trade active
Trade closed: target reached
Free Telegram Signals: t.me/addlist/MLJjjTl2V-M1OTc8
👉Get 20% Deposit BONUS - bit.ly/trenddiva
👉Get 20% Deposit BONUS - bit.ly/trenddiva
Related publications
Disclaimer
The information and publications are not meant to be, and do not constitute, financial, investment, trading, or other types of advice or recommendations supplied or endorsed by TradingView. Read more in the Terms of Use.