Technical analysis of (XAU/USD) based on price action and technical indicators on the 15-minute timeframe. Here's a
---
Key Technical Insights:
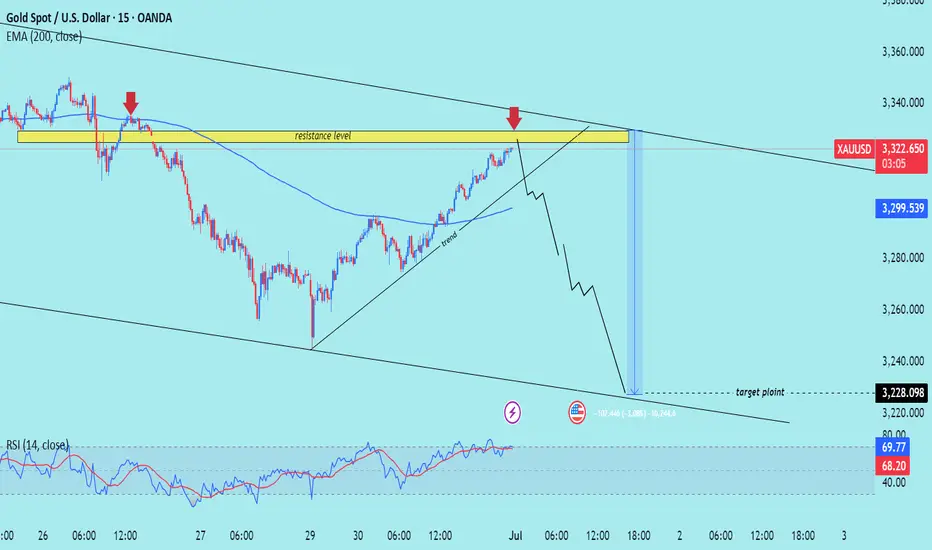
1. Resistance Level (Highlighted Yellow Zone):
Price is approaching a strong resistance zone (previous rejection marked by red arrows).
This area has historically pushed price downward.
2. Trendline Support (Rising Black Line):
Price has been following a short-term ascending trendline, forming higher lows.
A break below this trendline signals potential bearish reversal.
3. EMA 200 (Blue Line):
Price is currently above the EMA 200, indicating short-term bullish momentum.
However, price is testing resistance — a rejection could flip momentum bearish.
4. Bearish Rejection & Projection:
The chart shows an anticipated rejection from resistance, followed by a break of trendline support.
Target zone is marked near 3,228.098, indicating a drop of ~94 points from the current level.
5. RSI (Relative Strength Index):
RSI is nearing overbought territory (68.79).
A bearish divergence or RSI crossing down may confirm weakening momentum.
Mr SMC Trading point
---
Conclusion / Trading Idea:
Bias: Bearish
Entry Zone: Near the resistance level (~3,322)
Confirmation: Break of trendline support
Target: 3,228
Stop-Loss: Above resistance zone (just over the upper trendline)
---
pelas support boost 🚀 this analysis)
---
Key Technical Insights:
1. Resistance Level (Highlighted Yellow Zone):
Price is approaching a strong resistance zone (previous rejection marked by red arrows).
This area has historically pushed price downward.
2. Trendline Support (Rising Black Line):
Price has been following a short-term ascending trendline, forming higher lows.
A break below this trendline signals potential bearish reversal.
3. EMA 200 (Blue Line):
Price is currently above the EMA 200, indicating short-term bullish momentum.
However, price is testing resistance — a rejection could flip momentum bearish.
4. Bearish Rejection & Projection:
The chart shows an anticipated rejection from resistance, followed by a break of trendline support.
Target zone is marked near 3,228.098, indicating a drop of ~94 points from the current level.
5. RSI (Relative Strength Index):
RSI is nearing overbought territory (68.79).
A bearish divergence or RSI crossing down may confirm weakening momentum.
Mr SMC Trading point
---
Conclusion / Trading Idea:
Bias: Bearish
Entry Zone: Near the resistance level (~3,322)
Confirmation: Break of trendline support
Target: 3,228
Stop-Loss: Above resistance zone (just over the upper trendline)
---
pelas support boost 🚀 this analysis)
(Services:✔️ JOIN Telegram channel
#Gold trading ★Analysis★ 📊
Gold trading signals 🚀 99%
t.me/SmcTradingPoin
Join my recommended broker , link 👇
World best broker exness ✅D
one.exnesstrack.org/a/l1t1rf3p6v
#Gold trading ★Analysis★ 📊
Gold trading signals 🚀 99%
t.me/SmcTradingPoin
Join my recommended broker , link 👇
World best broker exness ✅D
one.exnesstrack.org/a/l1t1rf3p6v
Related publications
Disclaimer
The information and publications are not meant to be, and do not constitute, financial, investment, trading, or other types of advice or recommendations supplied or endorsed by TradingView. Read more in the Terms of Use.