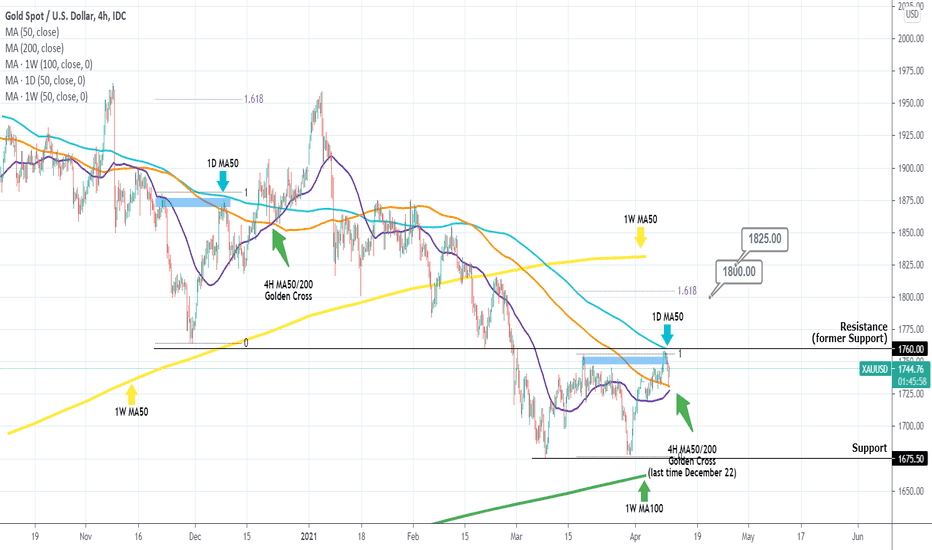
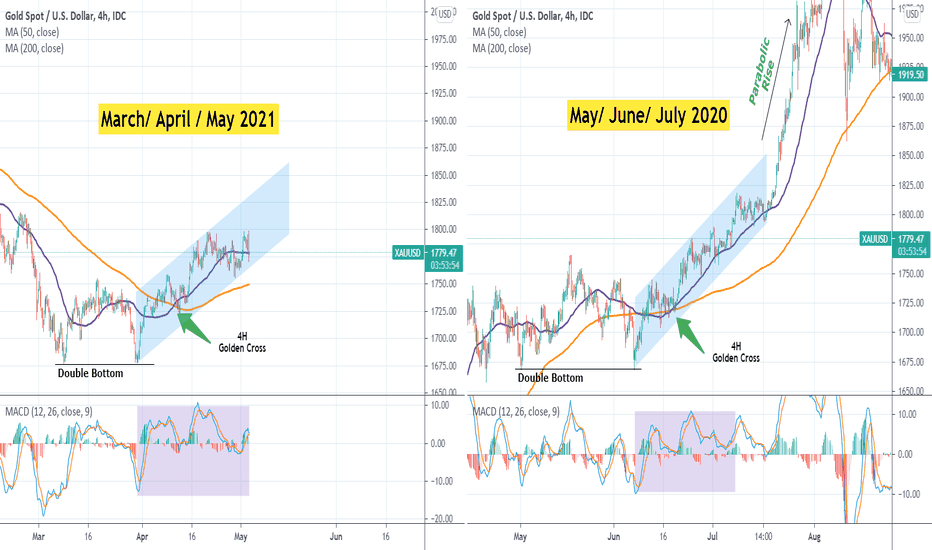
Gold (XAUUSD) is not secret that it has turned very bullish on the long-term. I've been mentioning since late March/ early April on a series of ideas that after the Double Bottom on the 1675 Support and the emergence of a 4H Golden Cross (MA50 crossing above the MA200), a Channel Up would develop:
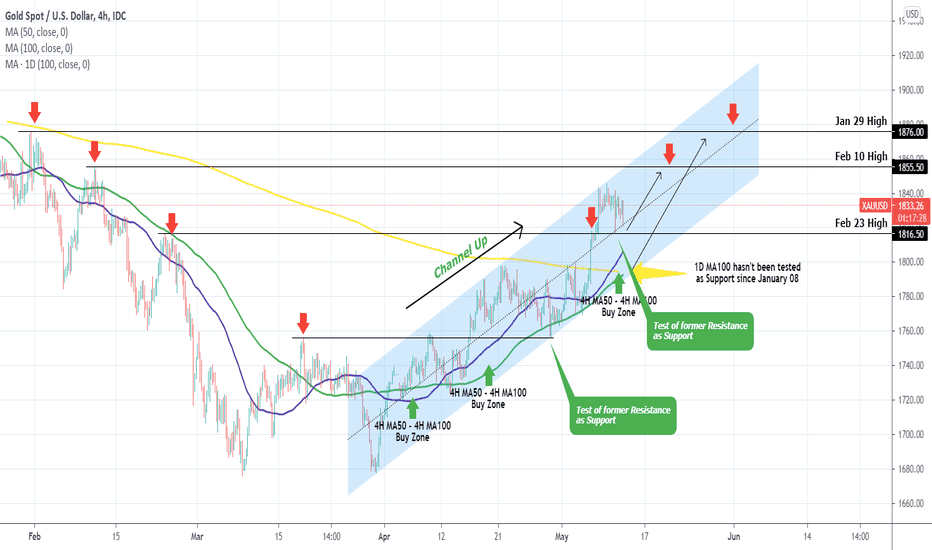
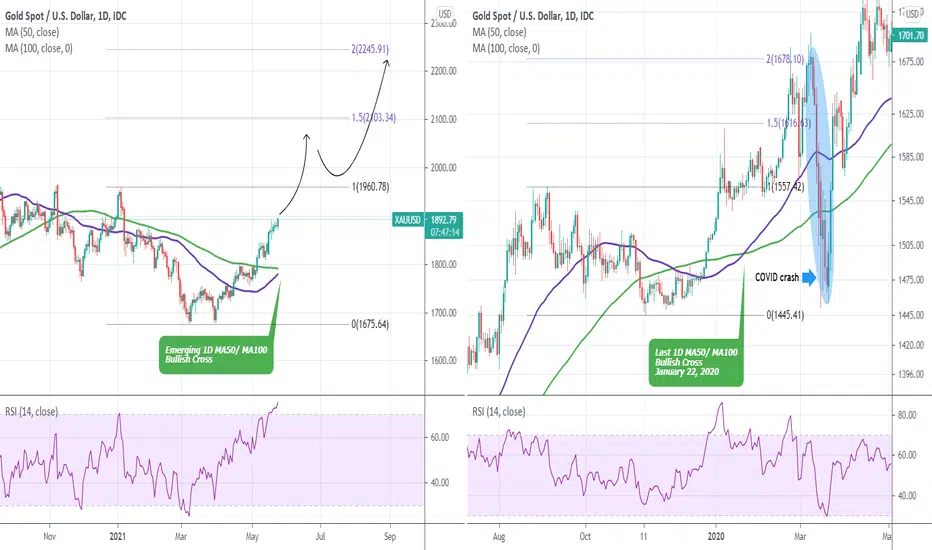
A new development though is emerging on the 1D chart this time, as the 1D MA50 (blue trend-line) is about to make a Bullish Cross above the 1D MA100 (green trend-line). Last time Gold formed this pattern was almost 1.5 years ago on January 22, 2020!
As you see from the main chart, the sequences are similar and they are accompanied by an equally similar RSI pattern. In early 2020 after the 1D MA50/100 Bullish Cross, Gold made an initial top just below the 1.5 Fibonacci extension and after some consolidation it made a Higher High just above the 2.0 Fibonacci extension (before the COVID meltdown took the global markets by storm).
What do you think, will this fractal be repeated? Feel free to share your work and let me know in the comments section!
Please like, subscribe and share your ideas and charts with the community!
--------------------------------------------------------------------------------------------------------
!! Donations via TradingView coins also help me a great deal at posting more free trading content and signals here !!
🎉 👍 Shout-out to TradingShot's 💰 top TradingView Coin donor 💰 this week ==> NMOTION29
--------------------------------------------------------------------------------------------------------
👑Best Signals (Forex/Crypto+70% accuracy) & Account Management (+20% profit/month on 10k accounts)
💰Free Channel t.me/tradingshotglobal
🤵Contact info@tradingshot.com t.me/tradingshot
🔥New service: next X100 crypto GEMS!
💰Free Channel t.me/tradingshotglobal
🤵Contact info@tradingshot.com t.me/tradingshot
🔥New service: next X100 crypto GEMS!
Disclaimer
The information and publications are not meant to be, and do not constitute, financial, investment, trading, or other types of advice or recommendations supplied or endorsed by TradingView. Read more in the Terms of Use.