XAU/USD Price Action Analysis – June 12, 2025 🪙📈
📊 Technical Overview:
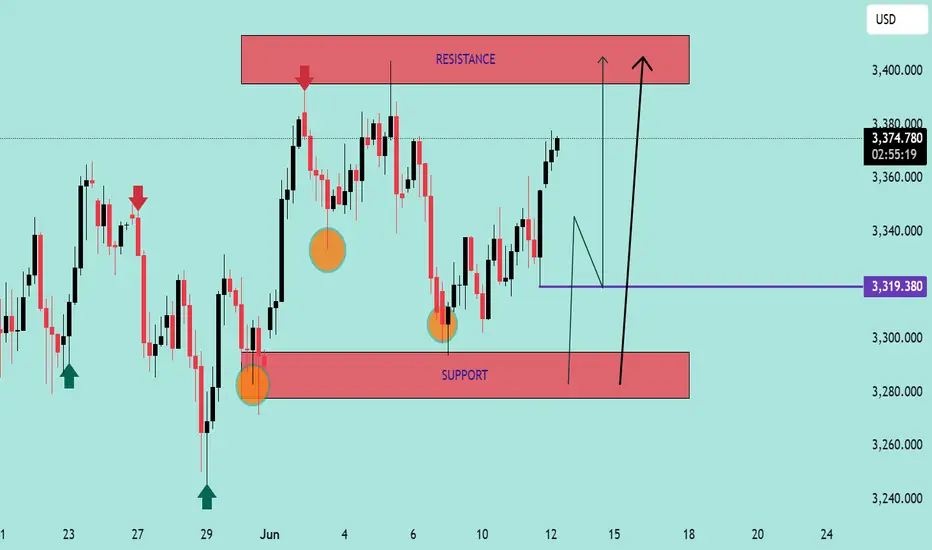
The chart presents a clear range-bound market structure with well-defined zones of support and resistance:
📍 Key Levels:
🔴 Resistance Zone: $3,380 – $3,400
Price has been rejected multiple times from this level, as indicated by red arrows. It marks a strong supply zone.
🟢 Support Zone: $3,280 – $3,300
Price has bounced several times from this demand area, forming a reliable support base.
📏 Intermediate Level: $3,319.38
Marked with a purple line, this is likely a mid-range liquidity zone or a previous minor structure level.
🔄 Price Action Insights:
Double Bottom Formation: Notable at the support zone, confirming strong buying interest (highlighted with orange circles and green arrows). This pattern often signals a bullish reversal.
Current Price: Trading near $3,375.645, approaching the resistance area again.
Projected Scenarios:
Bullish Continuation 📈: Break and close above the resistance could trigger momentum to the upside — watch for a breakout with strong volume.
Pullback Scenario 🔁: A rejection from resistance could cause a retest of $3,319.38 or even the support zone, forming a higher low before a potential rally.
🧠 Strategy Outlook:
Bullish Bias 🐂 as long as price holds above $3,319.38.
Watch for Breakout 🚀 above resistance with volume confirmation for long entries.
Caution ⚠️ near resistance; ideal to wait for either a breakout or clear rejection.
📌 Conclusion:
The chart reflects accumulation within a range, with bullish structure emerging. A break above $3,400 could shift market sentiment decisively upward, while a failure at resistance invites a deeper pullback.
📊 Technical Overview:
The chart presents a clear range-bound market structure with well-defined zones of support and resistance:
📍 Key Levels:
🔴 Resistance Zone: $3,380 – $3,400
Price has been rejected multiple times from this level, as indicated by red arrows. It marks a strong supply zone.
🟢 Support Zone: $3,280 – $3,300
Price has bounced several times from this demand area, forming a reliable support base.
📏 Intermediate Level: $3,319.38
Marked with a purple line, this is likely a mid-range liquidity zone or a previous minor structure level.
🔄 Price Action Insights:
Double Bottom Formation: Notable at the support zone, confirming strong buying interest (highlighted with orange circles and green arrows). This pattern often signals a bullish reversal.
Current Price: Trading near $3,375.645, approaching the resistance area again.
Projected Scenarios:
Bullish Continuation 📈: Break and close above the resistance could trigger momentum to the upside — watch for a breakout with strong volume.
Pullback Scenario 🔁: A rejection from resistance could cause a retest of $3,319.38 or even the support zone, forming a higher low before a potential rally.
🧠 Strategy Outlook:
Bullish Bias 🐂 as long as price holds above $3,319.38.
Watch for Breakout 🚀 above resistance with volume confirmation for long entries.
Caution ⚠️ near resistance; ideal to wait for either a breakout or clear rejection.
📌 Conclusion:
The chart reflects accumulation within a range, with bullish structure emerging. A break above $3,400 could shift market sentiment decisively upward, while a failure at resistance invites a deeper pullback.
JOIN MY TELEGRAM CHANNEL
t.me/StellarMarketAnalysis
JOIN MY RECOMMENTED BROKER REFFREL LINK
⤵️one.exnesstrack.net/a/uvd1etcgg1
PARTNER CODE⤵️
uvd1etcgg1
t.me/StellarMarketAnalysis
JOIN MY RECOMMENTED BROKER REFFREL LINK
⤵️one.exnesstrack.net/a/uvd1etcgg1
PARTNER CODE⤵️
uvd1etcgg1
Disclaimer
The information and publications are not meant to be, and do not constitute, financial, investment, trading, or other types of advice or recommendations supplied or endorsed by TradingView. Read more in the Terms of Use.