Gold Market Analysis:
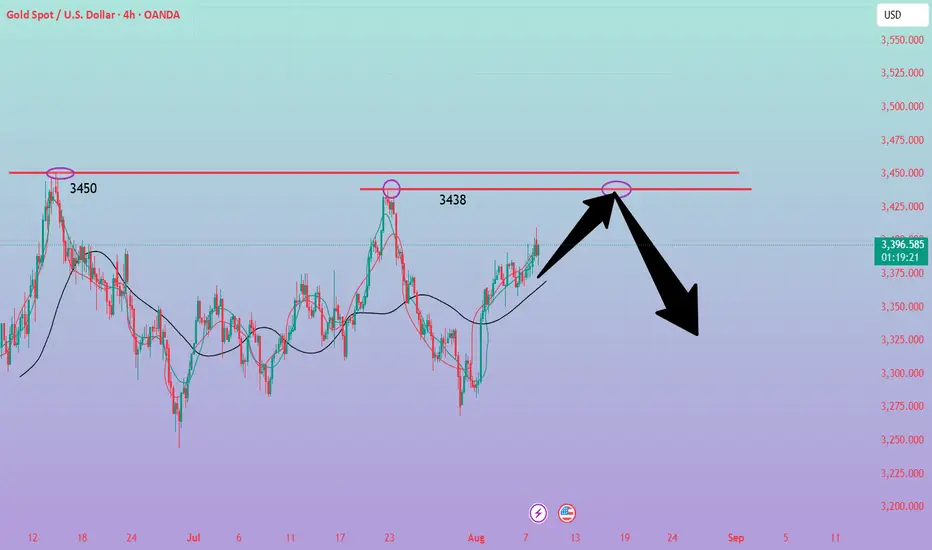
Gold's daily chart shows, as we previously discussed, a period of significant volatility within a high range. The previous non-farm payroll data and a series of other data points haven't triggered a major rally in gold. This period of volatility on the daily and weekly charts has lasted for four months. Gold needs a breakout in the future. Whether it breaks above or below, it will likely trigger a massive unilateral move. New traders fear unilateral moves, while experienced traders fear volatile trading. Large unilateral moves will likely take advantage of new traders, so it's crucial to establish stop-loss orders on each trade. In the short term, gold is currently rising in a wave structure. Yesterday, the US market reached 3408. The 3438 to 3450 range on the analysis chart is a barrier. Selling will require a major rebound here. I predict several more upward rallies today, so the short-term strategy for today is to buy low. The 4H chart of gold clearly shows a major upward and downward movement. Therefore, if it approaches the resistance range again, there's a possibility of a dip or reversal. The 1H chart reached 3370. If this level isn't broken today, we'll continue to buy. If it does, we'll adjust our strategy. We already bought at 3383 in the Asian session. Be mindful of volatile markets; wait and see, not rush into them. Gold trading in the Asian session between 3383 and 8370 presents buying opportunities.
Support is at 3383-3380, with strong support at 3370. Resistance lies at 3408 and 3438, with 3383 being the dividing line between strength and weakness.
Fundamental Analysis:
The tariff war has been the most significant fundamental factor impacting gold recently, but it will support it in the long term. This surge in gold prices is driven by Trump's renewed efforts, and the Federal Reserve's future monetary policy remains a key focus.
Trading Strategy:
Buy gold near 3381, target 3399-3438
Disclaimer
The information and publications are not meant to be, and do not constitute, financial, investment, trading, or other types of advice or recommendations supplied or endorsed by TradingView. Read more in the Terms of Use.
Disclaimer
The information and publications are not meant to be, and do not constitute, financial, investment, trading, or other types of advice or recommendations supplied or endorsed by TradingView. Read more in the Terms of Use.