Chart Overview:
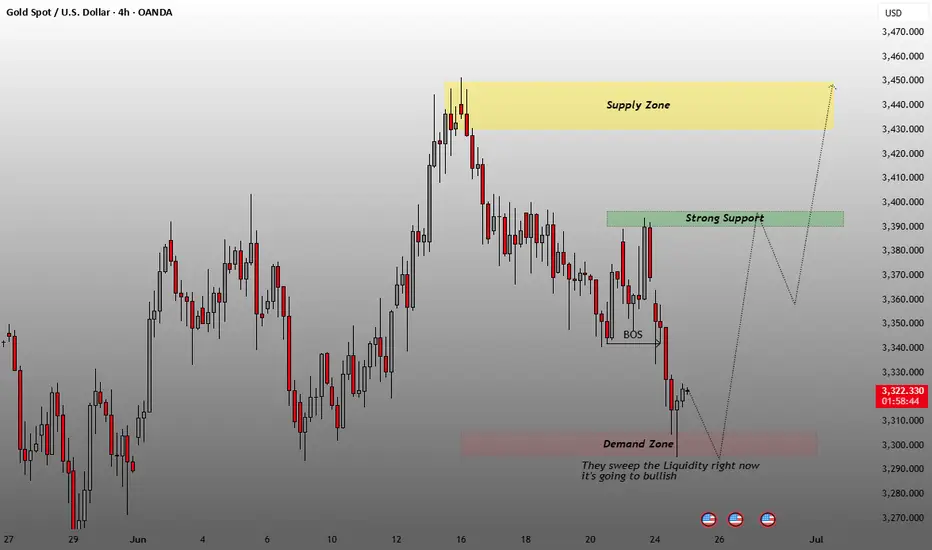
Instrument: Gold Spot / U.S. Dollar (XAU/USD)
Timeframe: 4-hour
Price at time of screenshot: 3,321.910 USD
🔍
Key Zones & Labels:
🟡
Supply Zone
(Top - Yellow Area):
Around 3,440 – 3,460
Expected reversal/resistance zone; price may react here with selling pressure.
🟩
Strong Support
(Green Area):
Near 3,390 – 3,400
Former support zone that may act as resistance on retracement (support-turned-resistance).
🟧
Demand Zone
(Bottom - Pink Area):
Around 3,280 – 3,310
Strong buying interest shown; price likely to reverse or consolidate in this zone.
🧠
Annotated Insights:
BOS (Break of Structure):
Indicates a bearish structure shift before price tapped into the demand zone.
Liquidity Sweep:
The note says:
“They sweep the Liquidity right now it’s going to bullish”
Suggests stop-losses below demand were taken out (liquidity grab), hinting at a potential bullish reversal.
Projection (Gray Arrows):
Shows two possible price paths:
Rejection at strong support and continuation to supply zone.
Direct move from demand to supply zone.
📌
Purpose of Chart:
This chart is likely used for Smart Money Concept (SMC) or Institutional Order Flow analysis, showing:
Liquidity zones
Structure breaks
Probable bullish reversal
Trade active
Disclaimer
The information and publications are not meant to be, and do not constitute, financial, investment, trading, or other types of advice or recommendations supplied or endorsed by TradingView. Read more in the Terms of Use.
Disclaimer
The information and publications are not meant to be, and do not constitute, financial, investment, trading, or other types of advice or recommendations supplied or endorsed by TradingView. Read more in the Terms of Use.