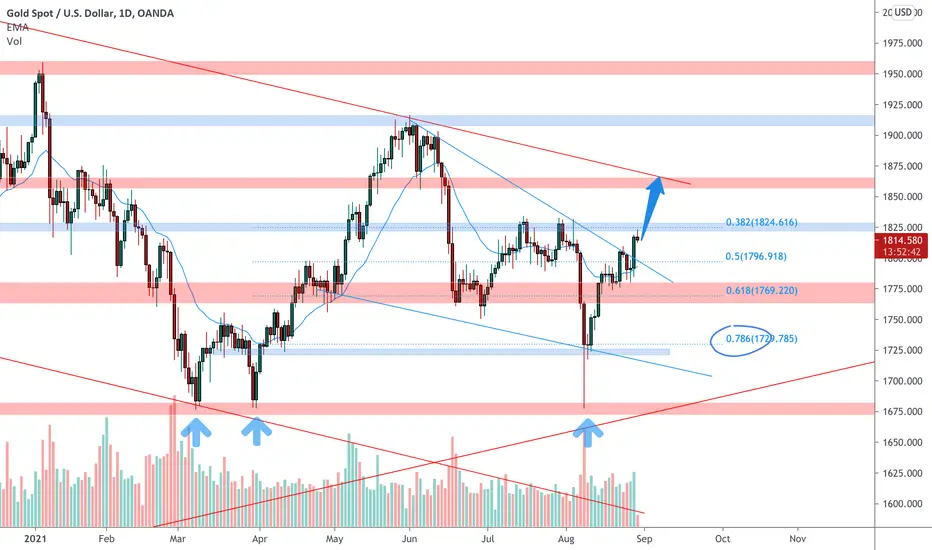
GOLD on the daily chart after the triple test of the support area at the 1680 level is moving between 2 narrowing trendlines .
The price after the recent high has reversed exactly over a daily structure at the 0.786 Fibonacci level and according to Ploancton's strategy IF the market will break above the resistance area and satisfy the Academy conditions we will set a nice long order.
--––
Follow the Shrimp
Keep in mind.
🟣 Purple structure -> Monthly structure.
🔴 Red structure -> Weekly structure.
🔵 Blue structure -> Daily structure.
🟡 Yellow structure -> 4h structure.
⚫️ Black structure -> <4h structure.
Here is the Plancton0618 technical analysis , please comment below if you have any questions.
The ENTRY in the market will be taken only if the condition of the Plancton0618 strategy will trigger
Note
Note
Note
Note
Note
Disclaimer
The information and publications are not meant to be, and do not constitute, financial, investment, trading, or other types of advice or recommendations supplied or endorsed by TradingView. Read more in the Terms of Use.
Disclaimer
The information and publications are not meant to be, and do not constitute, financial, investment, trading, or other types of advice or recommendations supplied or endorsed by TradingView. Read more in the Terms of Use.