1. 🔍 News interpretation
This week, gold continued to pull back, especially in the Asian session on Friday, which once fell to a one-week low, and the overall performance was weak. It was mainly affected by the following key factors:
1. The Fed's policy stance continued to be hawkish (bad news)
This week's FOMC meeting kept interest rates unchanged;
The dot plot shows that there will only be two interest rate cuts by the end of 2025;
And postponed the expectation of further interest rate cuts in 2026-2027;
This move strengthened the expectation of "long-term high interest rates" and formed a systematic suppression on gold prices.
2. The US dollar index fluctuated and fell (short-term bullish)
The US dollar index hit a stage high at the beginning of this week and then fell back;
The correction of the US dollar index provided some support for gold prices and eased downward pressure.
3. Geopolitical and risk aversion factors are still fermenting (limiting the decline)
The situation in the Middle East continues to be tense;
There is uncertainty in the outlook for global trade;
The market's risk aversion demand is still there, becoming an important support for gold prices.
✅ Comprehensive judgment: The hawkish stance of the Federal Reserve dominates the market, and gold is under pressure and falls in the short term; risk aversion provides bottom support for it, and the overall long and short positions are intertwined, with weak fluctuations as the main trend.
2. 📊 Technical trend analysis
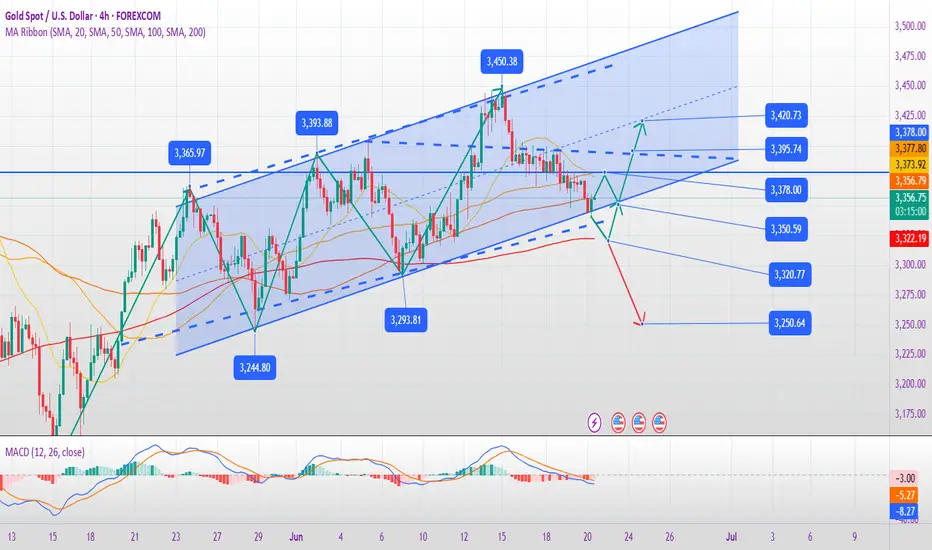
1. Overview of the current structure
This week, gold failed to continue its upward trend after reaching 3450;
Friday's intraday decline to the 3342-3345 range just tested the lower edge of the 4-hour upward channel;
The current trend shows a technical pattern of "weak highs - limited rebounds - weak fluctuations".
2. Key technical signals
Cycle Indicator status Interpretation
Weekly MACD dead cross is approaching, medium- and long-term bearish is being confirmed
Daily kinetic energy column turns into a negative line, bullish energy is weakened, bearish is dominant
1 hour fast and slow lines dead cross, located below the 0 axis, short-term selling signal is strengthened
3. Support and resistance analysis
Current support level: 3342 (lower edge of the channel), if it breaks down, the decline may be expanded to 3250;
Upper resistance level: 3368-3378 range (previous rebound high point), with obvious pressure;
If it falls below 3342, the space below will be reopened, and the potential decline may reach 100 US dollars.
III. 🎯 Operation strategy suggestions
The current market is volatile and weak. It is recommended to continue to adopt the strategy of high-short as the main and low-long as the auxiliary to flexibly respond to fluctuations.
✅ Short on rebound 3372–3378 Stop loss above 3385 Target 3335–3320 Trend is bearish, short on pressure
✅ Support light position to try long 3325–3330 Stop loss 3320 Target 3360–3370 Short-term game rebound, fast in and fast out
⚠️ Risk warning: If it falls rapidly and breaks through 3342, it is necessary to quickly adjust the long position and stop going long, and beware of inertial downward break that triggers a deep correction to the 3250 area.
IV. 📌 Focus of the market outlook
Speech by Fed officials and economic data release (expected interest rate direction)
Trends of the US dollar index and US Treasury yields
The impact of the Middle East and global trade situation on risk aversion
Can gold maintain the key technical level of 3342
Trade active
Analysis and strategy of gold trend in the US market:
Key technical signals
Trend structure
4-hour chart: The lower rail support of the rising channel is near 3340-3342. If it falls below, it may accelerate downward to 3250 (measured target).
Weekly MACD: Potential dead cross is forming, the daily momentum is turning downward, and the risk of medium-term adjustment is increasing.
Long-short watershed
Resistance: 3378-3388 (short-term rebound strength and weakness, breakthrough requires news cooperation).
Support: 3340-3350 (break to open the downward space).
Trading strategy suggestions
Short-dominated
Short-selling on rebound: try shorting with a light position near the 3378-3388 area, stop loss above 3400, target 3350-3340, break below and hold to see 3250.
Breakout and short-selling: If 3340 is effectively broken (such as 30-minute closing confirmation), you can follow up with short orders, with a target of 3300-3280.
Long defense
Be cautious when going long: only go long when the 3340-3350 support zone stabilizes (such as a quick rebound + the rising line engulfs the falling line), stop loss 3330, target 3370.
Signal on the right: Wait for the 4-hour closing line to return to the channel or break through 3388 before considering a reversal strategy.
Risk warning
Escalation of geopolitical conflicts: If there is a sudden risk event (such as a deterioration in the situation in the Middle East), the decline may be reversed quickly, and short orders need to be stopped in time.
Changes in the Fed's remarks: Pay attention to the adjustment of interest rate expectations in officials' speeches, which may trigger sharp short-term fluctuations.
❤️Free gold trading signals:t.me/+OJSbWQ6F4KM2Mzk1
💥Gold trading analyst | Technology + logic dual drive
💯Intraday/band strategy analysis | Risk control first, win in stability
💥Gold trading analyst | Technology + logic dual drive
💯Intraday/band strategy analysis | Risk control first, win in stability
Related publications
Disclaimer
The information and publications are not meant to be, and do not constitute, financial, investment, trading, or other types of advice or recommendations supplied or endorsed by TradingView. Read more in the Terms of Use.