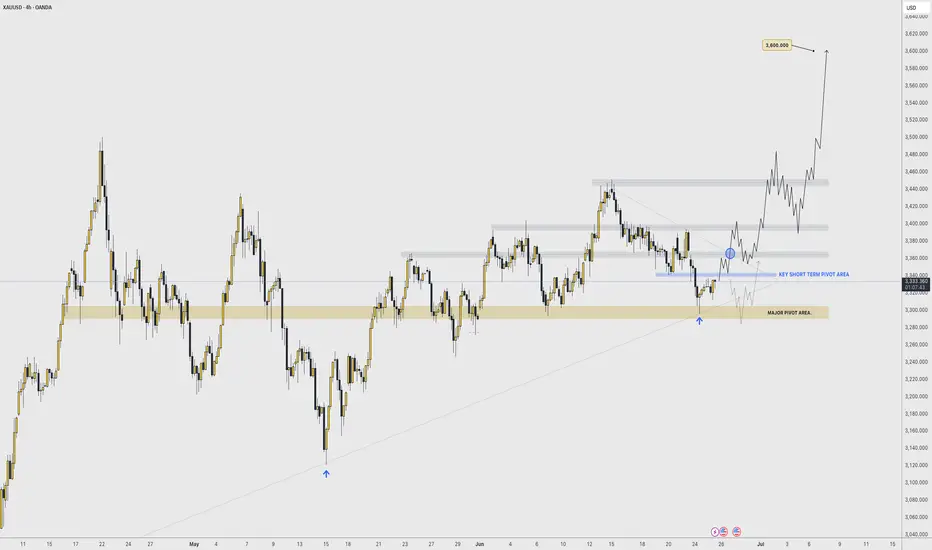
As illustrated, Im trying to visualize what a potential bull run could look like starting from what seems to be a "bullish signature" move by gold: a diagonal double bottom.
Don't believe me; go back in time and study how gold makes bottoms and how new bull runs start. The fact that it was NY that manipulated BOTH times and got the best price, is a strong footprint that MIGHT just indicate a potential bottom (at least of this current bearish correction.
I won't say "this is it" and ATH are next FROM this potential rebound; HOWEVER, it could indicate at least the next 10 to 24 hours of potential bullish impulse to retest a degree of the bearish drop since Sunday's weekly open.
Hammer candle from Tuesday's NY session low + today's 4H bullish engulfing, are also powerful components that show bullish strength indicating 3300 to be a major support area.
I'm expecting (BUT NOT ADVISING) Asia to break aggressively to the upside confirming that this could have been this current correction's bottom, and/or at least this week's low.
Should Thursday close above Tuesday's high or consolidating near it, also shows signs of bullish strength and opens the door for Friday to make a second bullish impulse move.
This would reflect on the Weekly candle leaving a long rejection wick and closing (potentially) back above 3350 - 3360.
Should this be the case, the following week would have the road paved to lift off price to retest previous 4H highs of 3440 - 3450 range.
...
July is a bullish month historically. Don't believe me; search "seasonality tool, gold" and see it for yourself.
It is a matter of weeks for Gold to breakout of this wide accumulation phase it has been since end of April, and start a fresh and brand new bull run that could/should last until the end of the year.
-
GOOD LUCK
Persa
Disclaimer
The information and publications are not meant to be, and do not constitute, financial, investment, trading, or other types of advice or recommendations supplied or endorsed by TradingView. Read more in the Terms of Use.
Disclaimer
The information and publications are not meant to be, and do not constitute, financial, investment, trading, or other types of advice or recommendations supplied or endorsed by TradingView. Read more in the Terms of Use.