Here’s the detailed breakdown of the NAS100 1H Chart based on Volume Profile, Gann analysis, and custom indicators (CVD + ADX):
1. Key Observations (Volume, Gann & CVD + ADX Focused)
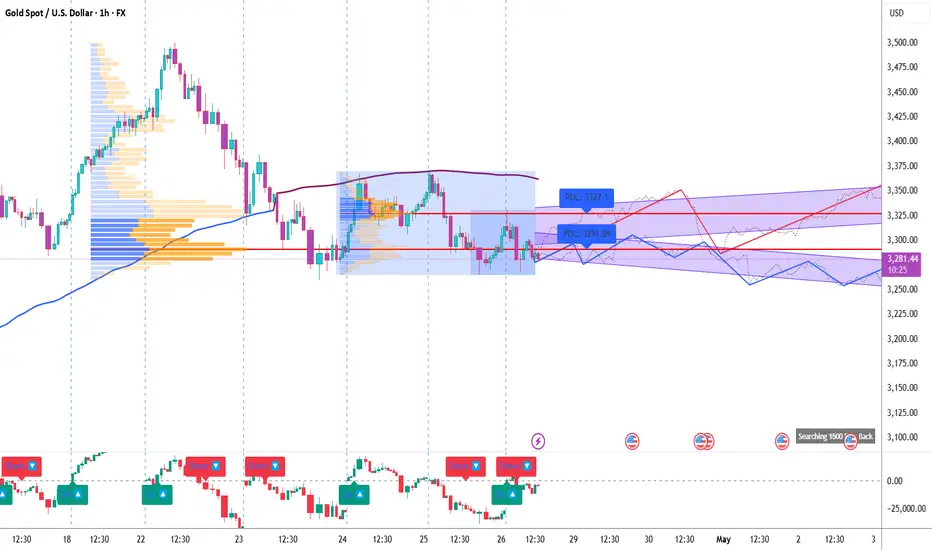
a) Volume Profile Insights:
• Value Area High (VAH): 3,327.1
• Value Area Low (VAL): 3,291.09
• Point of Control (POC): 3,291.09
• High-volume nodes: Between 3,290 and 3,310 (visible dense volume clusters).
• Low-volume gaps: Below 3,270 and above 3,340, price can move fast through these zones.
b) Liquidity Zones:
• Potential stop clusters: Around 3,300 (recent highs), and 3,280 (recent lows).
• Order absorption zones: Strong at 3,291 (POC) and 3,327 (VAH), indicating large player interest.
c) Volume-Based Swing Highs/Lows:
• Swing High (Volume Spike): 3,327 (strong rejection noted).
• Swing Low (Volume Spike): 3,283 (buying absorption observed).
d) CVD + ADX Indicator Analysis:
• Trend Direction: Range-bound
• ADX Strength:
o ADX < 20, confirming a weak trend / ranging market.
• CVD Confirmation:
o CVD mostly falling slightly with weak price response → slight supply dominance but no strong push.
________________________________________
2. Support & Resistance Levels
a) Volume-Based Levels:
• Support:
o 3,291 (POC support zone)
o 3,283 (Volume-based swing low)
• Resistance:
o 3,327 (VAH resistance zone)
o 3,300 (Minor psychological resistance)
b) Gann-Based Levels:
• Recent Gann Swing High: 3,327
• Recent Gann Swing Low: 3,283
• Key retracements:
o 1/2 level: 3,305
o 1/3 level: 3,300
o 2/3 level: 3,315
________________________________________
3. Chart Patterns & Market Structure
a) Trend:
• Range-bound (confirmed by flat ADX and neutral CVD behavior).
b) Notable Patterns:
• Potential descending channel forming between 3,327 resistance and 3,280 support.
• No strong breakout/breakdown yet, price oscillating around mid-volume zones.
• Possible re-tests at POC and VAH regions.
________________________________________
4. Trade Setup & Risk Management
a) Bullish Entry (If CVD + ADX confirm uptrend):
• Entry Zone: 3,283 – 3,291 (POC and volume support)
• Targets:
o T1: 3,305 (1/2 retracement and minor resistance)
o T2: 3,327 (VAH and major resistance)
• Stop-Loss (SL): 3,275 (below recent swing low)
• RR: Minimum 1:2
b) Bearish Entry (If CVD + ADX confirm downtrend):
• Entry Zone: 3,327 (VAH resistance)
• Target:
o T1: 3,291 (POC)
• Stop-Loss (SL): 3,335 (above VAH and minor swing highs)
• RR: Minimum 1:2
c) Position Sizing:
• Risk only 1-2% of capital per trade.
Bharat Pandya @ProspireWealth
+91 9624044866
pandyabn76@gmail.com
+91 9624044866
pandyabn76@gmail.com
Disclaimer
The information and publications are not meant to be, and do not constitute, financial, investment, trading, or other types of advice or recommendations supplied or endorsed by TradingView. Read more in the Terms of Use.