🌀 Wave Structure
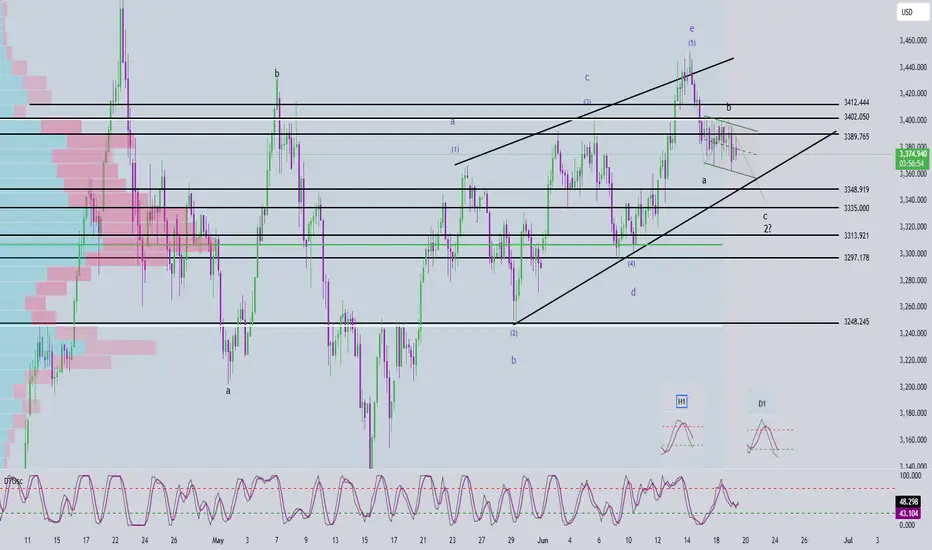
On the H4 timeframe, following a strong selloff, price is now consolidating within a narrow price channel — suggesting that we are currently in wave b (black) of an abc correction.
This structure implies that one more leg down is likely to complete wave c (black). However, due to the overlapping and sideways nature of the move, it's difficult to clearly identify the end points of waves a and b, making traditional Fibonacci targeting less effective.
➡️ To improve accuracy, we’re combining Volume Profile data with price action and have identified four key support zones:
3349, 3335, 3313, and 3297
Among these, we’re giving special attention to:
🎯 Target 1: 3335
🎯 Target 2: 3297
We'll wait for bullish momentum signals near these levels to increase the probability of catching the end of wave c.
🔋 Momentum Outlook
Daily (D1): Momentum is about to enter oversold territory. By the end of today or tomorrow, the daily candle is expected to confirm this — suggesting a weakening bearish trend.
H4: Also approaching oversold. If price is hovering around one of the key support levels (3349 | 3335 | 3313 | 3297) when this happens, and the D1 is already oversold, then we may be looking at a high-probability reversal zone.
H1: Nearly oversold as well — expect a short-term bounce soon. The best timing for a BUY will be when the H1 starts turning bullish while both the D1 and H4 are oversold.
✅ Trade Setup
🔹 Scenario 1
BUY ZONE: 3336 – 3333
SL: 3326
TP1 | TP2 | TP3: 3345 | 3378 | 3402
🔹 Scenario 2
BUY ZONE: 3300 – 3297
SL: 3290
TP1 | TP2 | TP3: 3313 | 3345 | 3402
⏳ Patience is key — wait for confluence between support zones and momentum reversals. That’s where the high-probability BUY setups emerge.
Trade active
At the moment, price is still following the previous plan, so we will continue to use the same targets and trade setup.🔄 Additional Update:
Wave c (black) is moving slowly with overlapping price action, suggesting that it may be forming an ending diagonal (five-wave triangle structure). While it's somewhat difficult to clearly identify the wave structure due to the overlapping nature, there is one important characteristic we can use in our strategy:
✅ When an ending diagonal completes, price often surges sharply. Therefore, if price fails to reach our predefined Entry zone but suddenly breaks out strongly, we can use the break above the upper boundary (formed by waves 2 and 4 in red) of the triangle as a signal to enter a BUY position.
Trade closed: target reached
💥 Price just surged with a strong H1 candle — exactly as anticipated. As mentioned earlier, when an ending diagonal pattern completes, price typically breaks out with strong momentum.This powerful H1 bullish candle is a strong signal that the current bearish leg may have come to an end, and a new upward phase could be underway.
📌 Continue monitoring price action around the breakout area for confirmation and manage your positions accordingly.
👉 Join the channel to receive more scalping signals!
Channel Telegram: t.me/+XkFQ95yHVOEwNDc1
Channel Telegram: t.me/+XkFQ95yHVOEwNDc1
Related publications
Disclaimer
The information and publications are not meant to be, and do not constitute, financial, investment, trading, or other types of advice or recommendations supplied or endorsed by TradingView. Read more in the Terms of Use.