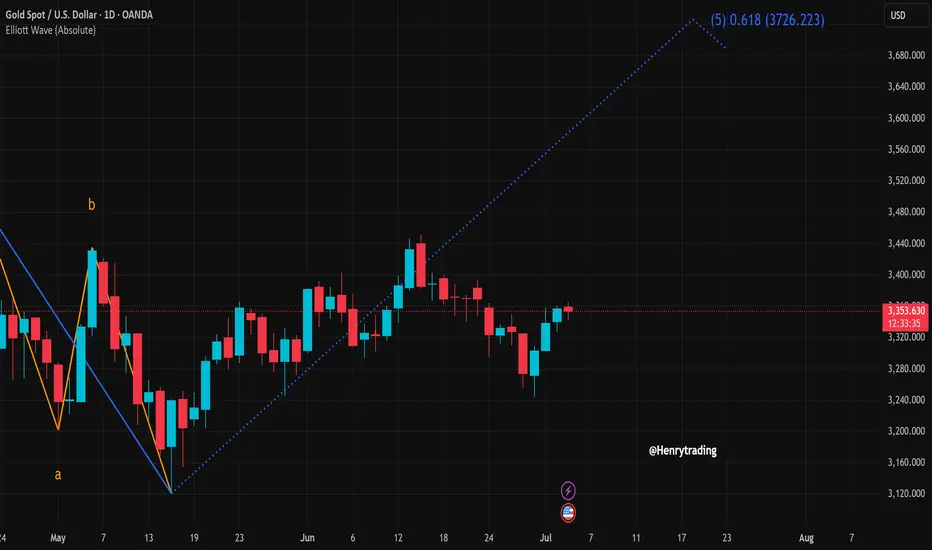
Gold (XAUUSD) is showing signs of a bullish recovery after a recent correction between the 3,290–3,340 USD zone. On the daily chart, a clear Elliott Wave formation is unfolding, with the price potentially entering wave 5 aiming for the 0.618 Fibonacci extension at 3,726 USD.
Clear Wave Structure:
The a-b-c corrective wave appears to have completed in mid-May.
The price is now in wave 3 and preparing for a potential extension in wave 5.
Candlestick and Buying Momentum:
Recent candles show strong buying pressure with four consecutive bullish sessions.
The current upward momentum is testing the 3,352 resistance – a breakout could open the path to 3,450 and eventually 3,726 USD.
Support & Resistance Levels:
Immediate support: 3,320 – 3,330 USD
Key resistance: 3,450 USD (recent swing high)
Extended target: 3,726 USD (Fibonacci 0.618 from wave 2 low to wave 3 peak)
Suggested Trading Strategy:
Favor buy on dip strategy, waiting for a minor pullback to the 3,330–3,340 area before entering long.
Set stop-loss below 3,300, with targets at 3,450 and 3,726 USD respectively.
Conclusion:
The XAUUSD chart suggests a potential strong bullish wave according to the Elliott Wave framework, with a breakout likely leading to the 3,726 USD zone. Traders should closely monitor price action around the 3,350 level for confirmation of continued upward momentum.
What’s your view on this analysis? Drop a comment and let’s discuss your trading strategy together!
🪙 JOIN OUR FREE TELEGRAM GROUP 🪙
t.me/dnaprofits
Join the community group to get support and share knowledge!
️🥇 Exchange and learn market knowledge
️🥇 Support free trading signals
t.me/dnaprofits
Join the community group to get support and share knowledge!
️🥇 Exchange and learn market knowledge
️🥇 Support free trading signals
Related publications
Disclaimer
The information and publications are not meant to be, and do not constitute, financial, investment, trading, or other types of advice or recommendations supplied or endorsed by TradingView. Read more in the Terms of Use.