Gold Market Analysis (Engulfing & Zone-Based Strategy)
This analysis is based on a straightforward zone-trading method using engulfing patterns and filtered key levels. The marked zones on the chart highlight high-probability trading areas.
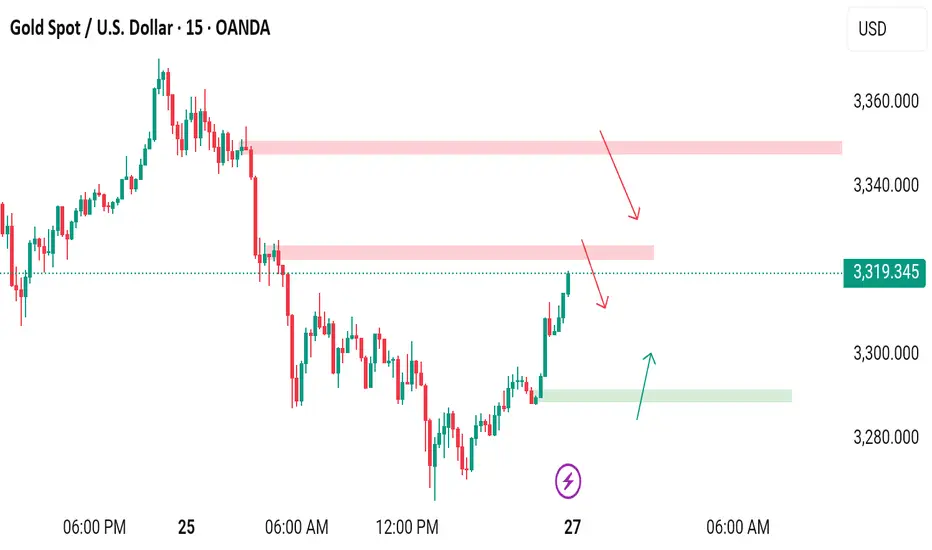
Red Zones (Sell Areas):
If the price enters these red-marked zones, we look for bearish confirmation to enter sell trades.
These zones are derived from the 4H timeframe, making them more reliable. If the market reacts from here, you can target around 60–80 pips in profit.
A second sell zone offers potential for a larger move—up to 150+ pips—if the price respects it.
Green Zones (Buy Areas):
If the price drops and enters the green-marked zone, it’s a signal to look for buy setups.
This area may deliver a strong bounce, potentially yielding 100+ pips.
There’s no need for complicated patterns or indicators—just follow the zones. If the price hits a zone and shows confirmation, you trade it.
Trade at your own risk DYOR!!
This analysis is based on a straightforward zone-trading method using engulfing patterns and filtered key levels. The marked zones on the chart highlight high-probability trading areas.
Red Zones (Sell Areas):
If the price enters these red-marked zones, we look for bearish confirmation to enter sell trades.
These zones are derived from the 4H timeframe, making them more reliable. If the market reacts from here, you can target around 60–80 pips in profit.
A second sell zone offers potential for a larger move—up to 150+ pips—if the price respects it.
Green Zones (Buy Areas):
If the price drops and enters the green-marked zone, it’s a signal to look for buy setups.
This area may deliver a strong bounce, potentially yielding 100+ pips.
There’s no need for complicated patterns or indicators—just follow the zones. If the price hits a zone and shows confirmation, you trade it.
Trade at your own risk DYOR!!
Trade active
As anticipated, the market reversed precisely from the selling zone I previously shared. You can clearly see on the charts how price filled that area and then dropped sharply over 580 pips. A significant move from that level. Were you able to catch it?Disclaimer
The information and publications are not meant to be, and do not constitute, financial, investment, trading, or other types of advice or recommendations supplied or endorsed by TradingView. Read more in the Terms of Use.
Disclaimer
The information and publications are not meant to be, and do not constitute, financial, investment, trading, or other types of advice or recommendations supplied or endorsed by TradingView. Read more in the Terms of Use.