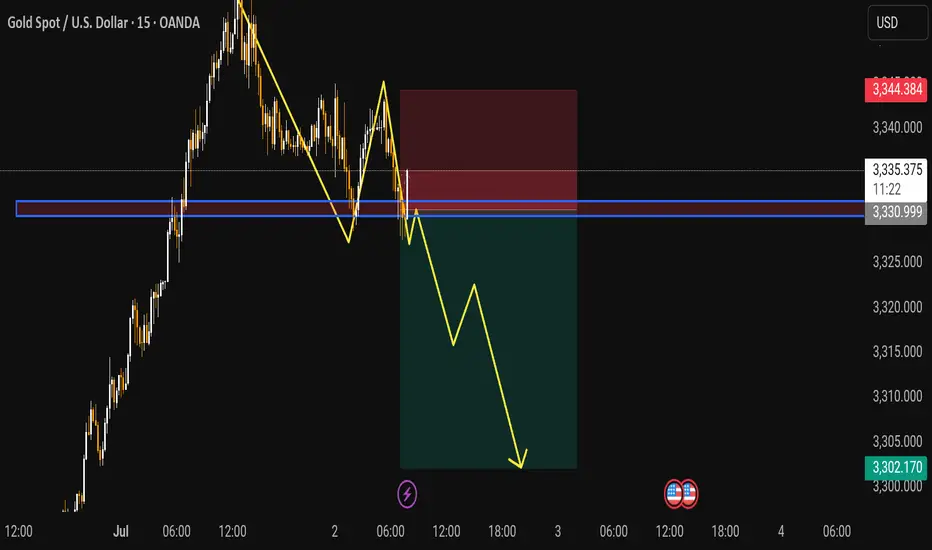
In this 15 minute chart of Gold Spot XAU/USD price action indicates a potential bearish setup following a strong upward move that has started to lose momentum
After reaching a peak near 3344 price formed a double top pattern followed by a series of lower highs and lower lows signaling a shift in market sentiment
The blue horizontal zone around 3331 3332 acted as a significant support level which has now been broken and is being retested as resistance
The yellow projection shows a bearish continuation scenario with price expected to reject the retest of the broken support and continue downward
The projected target for the bearish move is near 3302 indicating a significant downside potential
The risk zone highlighted in red lies above the resistance, likely placing the stop loss around the 3335 3340 range
This analysis suggests that if the price fails to reclaim the support turned-resistance zone bears could take control and drive price lower throughout the day
Trade active
Join Free Forex Signals
t.me/+Lw2yzKfOoWw0YmI0
t.me/+Lw2yzKfOoWw0YmI0
Disclaimer
The information and publications are not meant to be, and do not constitute, financial, investment, trading, or other types of advice or recommendations supplied or endorsed by TradingView. Read more in the Terms of Use.