We need to understand that price exists in one of two states — it's either moving up or down. If the movement is clear, we can identify a specific trend — either bullish or bearish. However, if we can’t determine the direction, it means the price is in a consolidation phase. Still, even within that consolidation, price is either rising or falling. Ultimately, it all comes down to the choice of timeframe.
Our trading objective
Our task is to identify the current state of the price and open a trade accordingly — in the direction of the price movement. This is the core goal, regardless of how one chooses to analyze the chart.
In my opinion, directly reading the market structure is the most reliable and professional way to interpret price action. So, what defines a trend? An uptrend is a sequence of higher highs and higher lows. A downtrend, in contrast, is a sequence of lower highs and lower lows.
This is the type of information we should be focusing on — using it to define the broader context. We start by identifying the trend on the higher timeframe, and then gradually move down to the lower timeframe. It’s clear that if we see an uptrend on the higher timeframe, it should be considered dominant. At the same time, it’s important to understand that within a global uptrend, corrections are natural and expected.
We use key levels to determine whether the trend is continuing or potentially reversing.
Example
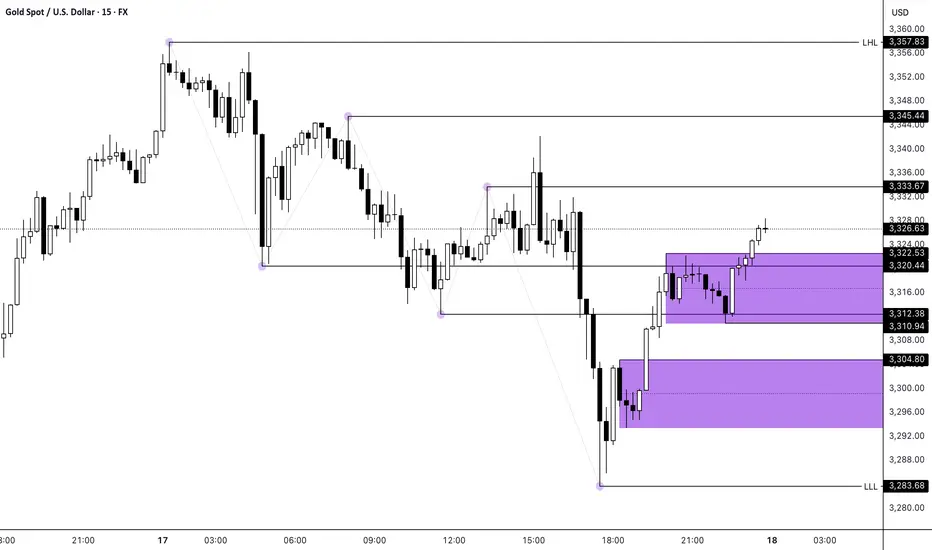
Let’s look at a chart example. The level of 3,357 is a key high. Then we see a pullback to 3,320, followed by a move up to 3,345. After that, there’s a break of the bullish structure — the price drops to 3,312, updating the previous low of 3,320. This marks a shift in structure.
Next, price returns to the range and prints a new high at 3,333 — slightly higher, around 3,340, but I’ve chosen 3,333 as the key level for clarity. However, this high is still lower than the previous 3,345, indicating that a local downtrend is beginning to form.
This whole structure drives the price down to 3,283. But we keep in mind the rule: we always consider the global trend, which is still bullish. That means every downward pullback is a potential buying opportunity.
Same here — we track price behavior and wait for confirmation. In this case, we can identify a level around 3,304. We wait for price to reclaim this level from below and attempt a long trade, with a stop-loss below the consolidation low (purple range), and take-profits at 3,312, 3,333, and up to 3,357. These previous key levels serve as our targets.
After that, we see the formation of a new consolidation and a return to the bullish structure — price stays above 3,312. The breakout above 3,322 confirms the continuation of the upward movement.
Conclusion
At this point, the same logic remains in play. In this scenario, we’re working from the long side, placing the stop-loss either below 3,310 (the bottom of the consolidation) or at the previous resistance level — 3,304. The targets remain unchanged.
If we see that price fails to hold above 3,322, we can consider switching to a short setup, with a stop-loss at 3,333 and a target at 3,283. This would confirm the formation of a lower high and signal the continuation of the downward structure.
I’m confident that we can’t truly predict the future — and in reality, we don’t need to. What matters is our ability to correctly read the structure and respond to how price behaves. That’s what allows us to build valid setups and execute them while strictly following risk management rules.
Our trading objective
Our task is to identify the current state of the price and open a trade accordingly — in the direction of the price movement. This is the core goal, regardless of how one chooses to analyze the chart.
In my opinion, directly reading the market structure is the most reliable and professional way to interpret price action. So, what defines a trend? An uptrend is a sequence of higher highs and higher lows. A downtrend, in contrast, is a sequence of lower highs and lower lows.
This is the type of information we should be focusing on — using it to define the broader context. We start by identifying the trend on the higher timeframe, and then gradually move down to the lower timeframe. It’s clear that if we see an uptrend on the higher timeframe, it should be considered dominant. At the same time, it’s important to understand that within a global uptrend, corrections are natural and expected.
We use key levels to determine whether the trend is continuing or potentially reversing.
Example
Let’s look at a chart example. The level of 3,357 is a key high. Then we see a pullback to 3,320, followed by a move up to 3,345. After that, there’s a break of the bullish structure — the price drops to 3,312, updating the previous low of 3,320. This marks a shift in structure.
Next, price returns to the range and prints a new high at 3,333 — slightly higher, around 3,340, but I’ve chosen 3,333 as the key level for clarity. However, this high is still lower than the previous 3,345, indicating that a local downtrend is beginning to form.
This whole structure drives the price down to 3,283. But we keep in mind the rule: we always consider the global trend, which is still bullish. That means every downward pullback is a potential buying opportunity.
Same here — we track price behavior and wait for confirmation. In this case, we can identify a level around 3,304. We wait for price to reclaim this level from below and attempt a long trade, with a stop-loss below the consolidation low (purple range), and take-profits at 3,312, 3,333, and up to 3,357. These previous key levels serve as our targets.
After that, we see the formation of a new consolidation and a return to the bullish structure — price stays above 3,312. The breakout above 3,322 confirms the continuation of the upward movement.
Conclusion
At this point, the same logic remains in play. In this scenario, we’re working from the long side, placing the stop-loss either below 3,310 (the bottom of the consolidation) or at the previous resistance level — 3,304. The targets remain unchanged.
If we see that price fails to hold above 3,322, we can consider switching to a short setup, with a stop-loss at 3,333 and a target at 3,283. This would confirm the formation of a lower high and signal the continuation of the downward structure.
I’m confident that we can’t truly predict the future — and in reality, we don’t need to. What matters is our ability to correctly read the structure and respond to how price behaves. That’s what allows us to build valid setups and execute them while strictly following risk management rules.
Note
The outcome of accurate structure analysis: price has reached the key level at 3,357.Disclaimer
The information and publications are not meant to be, and do not constitute, financial, investment, trading, or other types of advice or recommendations supplied or endorsed by TradingView. Read more in the Terms of Use.
Disclaimer
The information and publications are not meant to be, and do not constitute, financial, investment, trading, or other types of advice or recommendations supplied or endorsed by TradingView. Read more in the Terms of Use.